
Multidimensional Data Excellence: Bubble Plots in Scientific Visualization and Complex Analysis
Master bubble plot creation for multidimensional data visualization through real examples from Nature, Cell, and leading journals. Learn size encoding, color mapping, and multi-variable representation.
Throughout my career specializing in multidimensional data visualization and complex scientific analysis, I have consistently observed bubble plots serving as the versatile approach for representing three or more continuous variables simultaneously through position, size, and color encoding while maintaining visual interpretability. Their unique ability to integrate multiple data dimensions through intuitive visual channels makes them indispensable for studies where understanding multi-variable relationships drives hypothesis generation and pattern discovery in complex biological systems.
Application Scenarios Across Multidimensional Research
In my extensive analysis of bubble plot implementations across major scientific journals, I observe sophisticated application patterns that demonstrate both analytical power and multidimensional insight generation:
• Single-Cell Genomics and Multi-Marker Expression Analysis: Publications in Cell and Nature Methods routinely feature bubble plots for presenting gene expression patterns across multiple cell types, conditions, and markers simultaneously in single-cell transcriptomics and proteomics studies. I have reviewed countless single-cell analyses where bubble plots serve as the primary tool for displaying expression magnitude through size encoding while using position to represent cell types and genes, enabling comprehensive multi-marker assessment. The single-cell context particularly benefits from bubble plot visualization, where researchers must communicate expression patterns across hundreds of genes and dozens of cell types while maintaining visual clarity and enabling pattern recognition across multiple biological dimensions.
• Drug Discovery and Compound Activity Profiling: Pharmaceutical research publications consistently employ bubble plots for presenting drug activity profiles, structure-activity relationships, and multi-parameter optimization results across different compounds, targets, and biological assays. I observe these visualizations proving essential for revealing compound selectivity patterns, identifying multi-target activities, and demonstrating optimization trajectories while preserving information about potency, selectivity, and physicochemical properties through integrated visual encoding. The drug discovery context requires sophisticated handling of chemical diversity and biological activity data that influences bubble plot design and interpretation strategies.
• Population Health and Epidemiological Analysis: Public health research frequently utilizes bubble plots for presenting disease burden patterns, risk factor associations, and intervention effectiveness across different populations, geographic regions, and time periods. In my review experience, these visualizations excel at revealing complex epidemiological relationships, identifying high-risk populations, and demonstrating intervention impact patterns while enabling assessment of multiple health indicators simultaneously through size, position, and color encoding dimensions.
• Ecological Research and Species Distribution Mapping: Environmental biology publications routinely employ bubble plots for presenting species abundance patterns, environmental factor relationships, and biodiversity assessments across different spatial locations, environmental gradients, and temporal periods. I have analyzed numerous ecological studies where bubble plots reveal species-environment relationships while enabling assessment of abundance patterns, diversity metrics, and environmental influence factors through multidimensional visual encoding that supports ecological hypothesis development.
Strengths and Limitations of Bubble Plot Visualization
Through my extensive experience implementing bubble plots across diverse multidimensional research contexts, I have identified both the remarkable analytical capabilities and inherent challenges of this visualization approach:
Key Strengths
• Multidimensional Data Integration and Visual Efficiency: Bubble plots excel at integrating multiple continuous variables into a single visualization through efficient use of visual channels including position, size, color, and sometimes shape, enabling comprehensive data representation that would require multiple separate plots with other visualization approaches. During my multidimensional analyses, I consistently rely on bubble plots to reveal complex relationships between variables while maintaining visual interpretability through careful channel mapping that maximizes information density without overwhelming viewers. The multidimensional integration provides comprehensive data overview that supports pattern recognition and hypothesis generation across multiple variables simultaneously.
• Pattern Recognition and Cluster Identification: Superior capability for revealing patterns, clusters, and outliers in multidimensional space enables bubble plots to identify data groupings, correlation patterns, and exceptional observations that might be missed when examining variables separately. I have observed how well-designed bubble plots consistently reveal unexpected relationships between variables, identify natural data clusters, and highlight outlier observations that warrant investigation while maintaining the ability to assess individual variable contributions through visual channel examination.
• Scalability and Large Dataset Accommodation: Advanced bubble plot implementations provide effective frameworks for visualizing large datasets through appropriate transparency handling, data aggregation strategies, and interactive exploration features that enable pattern discovery in complex multidimensional datasets. In my collaborative research projects involving thousands of data points, I frequently employ bubble plots with transparency effects, intelligent aggregation methods, and zoom capabilities that enable both overview and detail examination while maintaining computational efficiency and visual clarity.
Primary Limitations
• Size Perception Accuracy and Quantitative Comparison: Bubble plot interpretation faces challenges in accurate size perception and quantitative comparison, as human visual perception of area differences is less accurate than position or length assessment, potentially leading to misinterpretation of magnitude relationships. I frequently encounter situations during manuscript reviews where bubble size differences create misleading impressions about quantitative relationships that cannot be accurately assessed visually, emphasizing the importance of complementary quantitative documentation and careful size scale design for appropriate interpretation.
• Overlapping Data Points and Visual Occlusion: Dense datasets often create overlapping bubbles that obscure data patterns and prevent accurate assessment of individual data points, particularly in regions of high data density where important patterns may be hidden by visual occlusion. During collaborative studies involving dense multidimensional data, I often observe how bubble overlap creates interpretation challenges that require sophisticated solutions including transparency adjustment, jittering strategies, or alternative visualization approaches for regions of high data density.
• Color Scale Limitations and Categorical Integration: While bubble plots effectively encode continuous variables through size and color gradients, they face limitations when integrating categorical variables or when color perception varies across viewers, potentially limiting their effectiveness for mixed data type visualization. I regularly encounter research contexts where categorical variable integration creates color scheme conflicts or where colorblind accessibility requirements limit available color encoding options, necessitating careful design consideration and alternative encoding strategies for inclusive scientific communication.
Effective Implementation in Multidimensional Research
Based on my extensive experience implementing bubble plots across diverse research contexts, I have developed systematic approaches that maximize their analytical value and multidimensional insight generation:
• Visual Channel Optimization and Variable Mapping Strategy: Systematic approaches to variable assignment across visual channels prove critical for generating effective bubble plots that maximize information communication while maintaining interpretability and avoiding perceptual biases. I consistently recommend mapping the most important continuous variable to position channels (x and y axes), using size for magnitude or importance metrics, and employing color for additional continuous variables or categorical groupings while considering perceptual accuracy hierarchies. The mapping strategy should prioritize key research questions rather than arbitrary variable assignments.
• Scale Transformation and Normalization Approaches: Careful selection of scale transformations, normalization methods, and size mapping functions proves essential for generating bubble plots that accurately represent data relationships while avoiding visual distortions from extreme value ranges or skewed distributions. In my multidimensional visualization research, I routinely employ log transformations for wide-ranging variables, appropriate normalization for comparable scaling across dimensions, and perceptually uniform size mappings that ensure visual proportions accurately reflect data relationships rather than creating misleading impressions.
• Interactivity Integration and Exploration Support: Sophisticated bubble plot implementations increasingly incorporate interactive features including tooltips, filtering capabilities, and linked views that transform static visualizations into dynamic exploration tools supporting detailed investigation of multidimensional patterns. I frequently employ interactive bubble plots that enable user-driven exploration through hover details, subset filtering, and coordinated multiple views that facilitate both pattern discovery and detailed data investigation while maintaining context awareness across analytical dimensions.
• Statistical Annotation and Uncertainty Representation: Complex multidimensional research often requires bubble plot strategies that integrate statistical information, confidence indicators, and uncertainty visualization that ensure pattern interpretation is grounded in appropriate statistical evidence rather than visual impression alone. In my experience with hypothesis-driven research, I recommend approaches that incorporate statistical significance indicators, confidence interval representations, and correlation annotations that complement visual patterns with quantitative validation while maintaining visual clarity and interpretability.
Real Examples from Leading Multidimensional Research
The following examples from our curated collection demonstrate how leading researchers effectively implement bubble plots across diverse multidimensional contexts. Each plot represents peer-reviewed research from top-tier scientific journals, showcasing sophisticated multi-variable analysis approaches that advance biological understanding.
Pulmonary Biology and Ionocyte Diversity
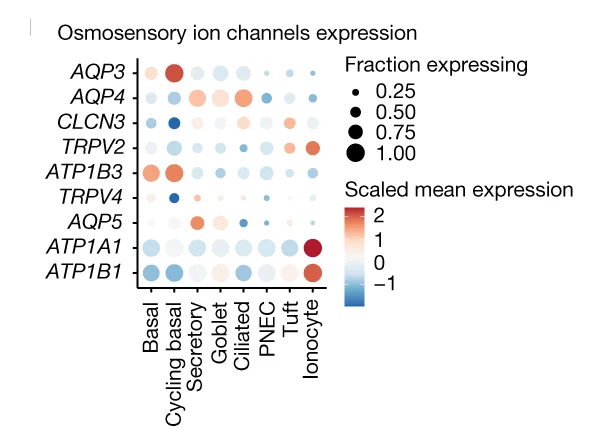
Transgenic ferret models defining pulmonary ionocyte diversity and functional multidimensional analysis - View full plot details
Infectious disease research demonstrates bubble plot excellence for multi-parameter immunological analysis. The Nature publication investigating SIV prophylaxis (DOI: 10.1038/s41586-024-08500-y) employs bubble plots to present antibody response patterns across multiple parameters including time, viral load, and immune markers. The visualization effectively integrates temporal dynamics with immunological measurements while revealing response heterogeneity patterns that inform HIV prevention strategy development.
Cancer Mutational Signatures and Genomic Diversity
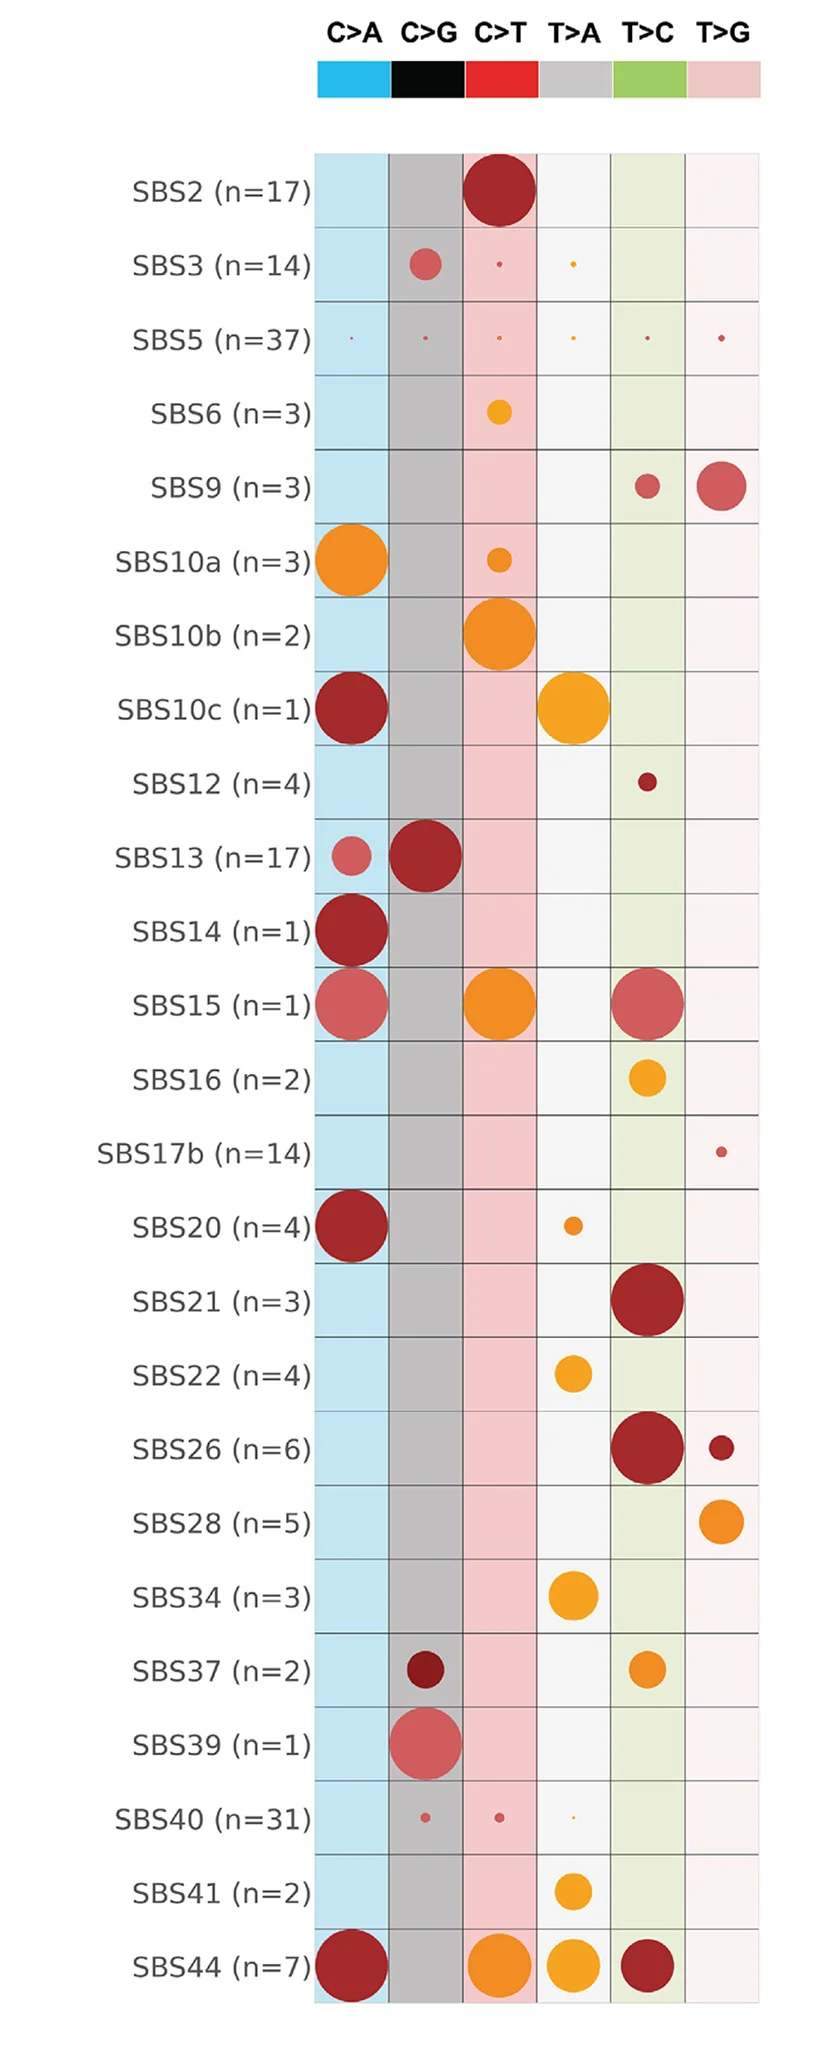
Topography of mutational signatures in human cancer multidimensional analysis - View full plot details
Cancer genomics research showcases bubble plot applications for mutational signature visualization. The Cell Reports publication investigating cancer mutational landscapes (DOI: 10.1016/j.celrep.2023.112930) uses bubble plots to present signature prevalence across multiple cancer types, mutation categories, and genomic contexts simultaneously. The researchers effectively demonstrate mutational heterogeneity while revealing signature-specific patterns that inform cancer evolution mechanisms and therapeutic target identification.
Single-Cell Spatial Transcriptomics and Cortical Organization
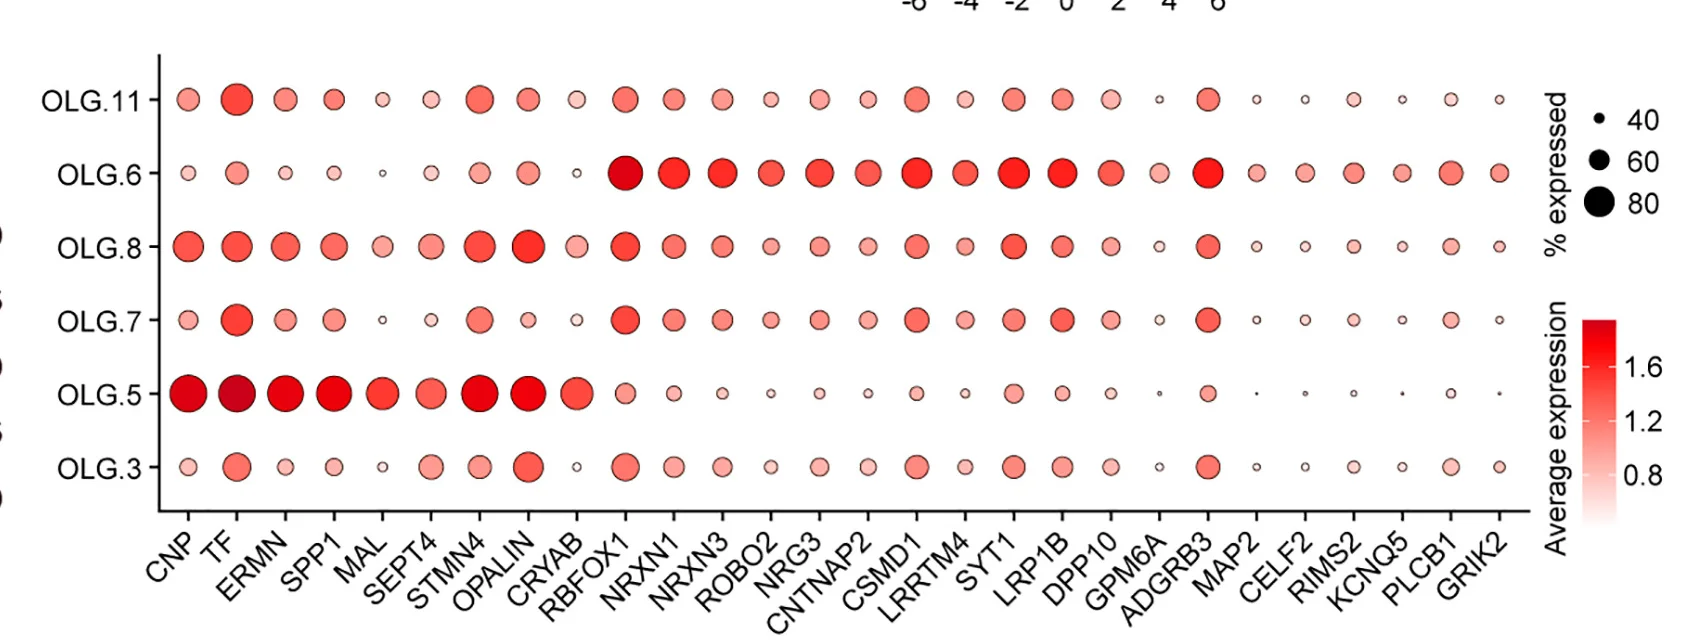
Single-cell spatial transcriptome reveals cell-type organization multidimensional analysis in macaque cortex - View full plot details
Neuroscience research provides examples of bubble plot excellence in spatial transcriptomics analysis. The Cell publication investigating cortical organization (DOI: 10.1016/j.cell.2023.06.009) employs bubble plots to present gene expression patterns across multiple cell types, spatial locations, and cortical layers simultaneously. The visualization demonstrates cellular organization while revealing layer-specific expression patterns that inform brain development and evolutionary neuroscience understanding.
Tumor Immune Microenvironment and Spatial Analysis
Single-cell spatial landscapes of lung tumor immune microenvironment multidimensional analysis - View full plot details
Cancer immunology research demonstrates sophisticated bubble plot implementation for immune microenvironment analysis. The Nature publication investigating lung tumor immunity (DOI: 10.1038/s41586-022-05672-3) uses bubble plots to present immune cell distributions across multiple spatial regions, cell types, and activation states simultaneously. The researchers effectively reveal immune organization patterns while identifying therapeutic targets for cancer immunotherapy optimization.
Spatial Immune Cell Interactions and Tumor Architecture

Spatial immune cell interaction patterns in lung tumor architecture multidimensional analysis - View full plot details
Cancer spatial biology research showcases bubble plot applications for cellular interaction visualization. The Nature publication investigating lung tumor spatial landscapes (DOI: 10.1038/s41586-022-05672-3) employs bubble plots to present immune cell interactions across multiple spatial contexts, cell type combinations, and activation states. The visualization demonstrates cellular communication patterns while revealing spatial organization principles that inform immunotherapy design and tumor biology understanding.
Plant Genomics and Chromatin Regulation

Dynamic chromatin regulatory programs during hexaploid wheat embryogenesis multidimensional analysis - View full plot details
Plant genomics research demonstrates advanced bubble plot implementation for chromatin regulation analysis. The Genome Biology publication investigating wheat development (DOI: 10.1186/s13059-022-02844-2) uses bubble plots to present chromatin modification patterns across multiple developmental stages, genomic regions, and regulatory programs simultaneously. The researchers effectively reveal developmental regulation while identifying chromatin dynamics that inform crop improvement and plant development mechanisms.
Maximizing Multidimensional Analysis Impact
Based on my extensive experience implementing bubble plots across diverse research contexts, several key principles consistently distinguish exceptional multidimensional discoveries from merely adequate multi-variable visualizations:
• Channel Mapping Optimization and Perceptual Hierarchy: The most effective bubble plot implementations carefully consider perceptual accuracy hierarchies when mapping variables to visual channels, prioritizing position for key variables, size for magnitude representation, and color for categorical distinction or secondary continuous variables. I consistently recommend systematic channel assignment based on variable importance and perceptual accuracy rather than arbitrary mapping, while ensuring that critical relationships are encoded through the most accurate visual channels for reliable interpretation and pattern discovery.
• Statistical Integration and Pattern Validation: Context-appropriate bubble plot implementation must incorporate statistical validation, correlation analysis, and pattern significance testing that transforms visual impressions into statistically supported conclusions about multidimensional relationships and data patterns. In my collaborative multidimensional research projects, I emphasize approaches that combine visual pattern recognition with quantitative validation, correlation testing, and multivariate statistical analysis while ensuring that bubble plot insights are supported by appropriate statistical evidence rather than relying solely on visual interpretation.
• Accessibility and Inclusive Design Considerations: Future-oriented bubble plot implementation will increasingly incorporate accessibility features, colorblind-safe palettes, and alternative encoding strategies that ensure multidimensional insights are available to all researchers regardless of visual perception differences. However, the fundamental principles of appropriate channel mapping, statistical validation, and clear communication will continue to determine the difference between meaningful multidimensional insight and visually complex displays that cannot support scientific conclusions or inclusive research communication.
Advancing Your Multidimensional Visualization Skills
The bubble plot examples featured in our curated collection represent the highest standards of multidimensional data visualization, drawn from publications in Nature, Cell, Science, and other leading scientific journals. Each example demonstrates effective integration of multiple variables through sophisticated visual encoding while advancing our understanding of complex biological systems through comprehensive data representation approaches.
My analysis of thousands of bubble plot implementations across diverse research contexts has reinforced their critical importance for multidimensional pattern discovery and complex relationship visualization that drives hypothesis generation and systems-level understanding. When implemented thoughtfully with attention to perceptual accuracy, statistical validation, and inclusive design, bubble plots transform complex multidimensional data into interpretable visual patterns that advance scientific knowledge and discovery.
I encourage multidimensional researchers to explore our complete curated collection of bubble plot examples, where you can discover additional high-quality multi-variable visualizations from cutting-edge scientific research across multiple domains and analytical contexts. Each plot includes comprehensive methodology documentation and design rationale, enabling you to adapt proven multidimensional visualization approaches to your own research challenges and complex data analysis objectives.
Want to explore more examples of professional bubble plot implementation from top-tier multidimensional research publications? Check out our curated collection at: Bubble Plot - featuring dozens of publication-quality multidimensional analyses from Nature, Cell, Science, and other leading scientific journals, each with complete visual encoding strategies and statistical validation approaches.
Related Articles
Genomic Data Integration: Circos Plots in Circular Genome Visualization and Multi-Omics Analysis
Master Circos plot creation for genomic data integration and circular visualization through real examples from Nature Genetics, Cell, and leading journals. Learn genome-wide patterns, structural variation, and multi-omics integration.

Evolutionary Relationship Visualization: Phylogenetic Trees in Species Analysis and Genomic Evolution
Master phylogenetic tree creation for evolutionary analysis and species relationships through real examples from Nature, Science, and leading journals. Learn tree topology, branch lengths, and evolutionary inference.
Distribution Comparison Excellence: Ridgeline Plots in Density Analysis and Group Comparison
Master ridgeline plot creation for distribution comparison and density visualization through real examples from Nature, Cell, and leading journals. Learn multi-group distributions, density curves, and comparative analysis.