Genomic Data Integration: Circos Plots in Circular Genome Visualization and Multi-Omics Analysis
Master Circos plot creation for genomic data integration and circular visualization through real examples from Nature Genetics, Cell, and leading journals. Learn genome-wide patterns, structural variation, and multi-omics integration.
Throughout my career specializing in genomics visualization and multi-omics data integration, I have consistently observed Circos plots serving as the comprehensive approach for displaying genome-wide data patterns, structural variations, and multi-layered genomic information through circular layouts that maximize information density while preserving chromosomal organization. Their unique ability to integrate multiple data types around a circular genome representation while enabling pattern recognition across genomic scales makes them indispensable for studies where understanding genome-wide relationships drives evolutionary insights and functional genomics discoveries.
Application Scenarios Across Genomic Research
In my extensive analysis of Circos plot implementations across major genomics journals, I observe sophisticated application patterns that demonstrate both analytical comprehensiveness and genomic insight generation:
• Structural Variation and Chromosomal Rearrangement Analysis: Publications in Nature Genetics and Genome Biology routinely feature Circos plots for presenting structural variant landscapes, chromosomal rearrangement patterns, and copy number variation analysis across different species and disease contexts. I have reviewed countless genomic studies where Circos plots serve as the primary tool for visualizing complex structural variations while simultaneously showing inter-chromosomal relationships and genomic instability patterns. The structural genomics context particularly benefits from Circos visualization when researchers must communicate both local structural changes and genome-wide rearrangement patterns to understand evolutionary processes and disease mechanisms.
• Multi-Omics Integration and Systems Genomics: Systems biology research publications consistently employ Circos plots for presenting integrated genomics, transcriptomics, and epigenomics data across multiple experimental conditions and biological contexts. I observe these visualizations proving essential for revealing coordinated multi-omics patterns while enabling identification of regulatory relationships and functional genomic interactions that span multiple chromosomes. The multi-omics context requires sophisticated data layer integration and scale normalization that influences Circos interpretation and systems-level understanding.
• Comparative Genomics and Evolutionary Analysis: Comparative genomics research frequently utilizes Circos plots for presenting synteny relationships, ortholog mapping, and evolutionary conservation patterns across different species and genomic regions. In my review experience, these visualizations excel at revealing genome organization conservation while enabling identification of evolutionary innovations and rearrangement events that inform speciation mechanisms and adaptive evolution understanding.
• Cancer Genomics and Tumor Heterogeneity: Cancer research publications routinely employ Circos plots for presenting tumor genome landscapes, somatic mutation patterns, and clonal evolution analysis across different cancer types and progression stages. I have analyzed numerous cancer studies where Circos plots reveal mutational signatures while enabling assessment of chromosomal instability patterns and therapeutic target identification that guide precision oncology approaches and treatment development strategies.
Strengths and Limitations of Circos Plot Visualization
Through my extensive experience implementing Circos plots across diverse genomic research contexts, I have identified both the remarkable analytical capabilities and inherent challenges of this circular visualization approach:
Key Strengths
• Comprehensive Genome-Wide Integration and Multi-Layer Visualization: Circos plots excel at integrating multiple genomic data types within a single comprehensive visualization that preserves chromosomal context while enabling pattern recognition across multiple biological scales and data dimensions. During my genomic analyses, I consistently rely on Circos plots to reveal genome-wide patterns while maintaining chromosomal organization that cannot be achieved through linear genome displays or separate data visualizations. The circular integration provides holistic genome perspective that supports systems-level understanding and hypothesis generation.
• Inter-Chromosomal Relationship Detection and Structural Pattern Recognition: Superior capability for revealing inter-chromosomal relationships, structural rearrangements, and trans-chromosomal interactions enables Circos plots to identify complex genomic patterns that would be missed in chromosome-by-chromosome analysis approaches. I have observed how well-designed Circos plots consistently reveal unexpected genomic relationships while enabling assessment of chromosomal interaction networks and structural variation impacts that inform evolutionary and disease mechanism understanding.
• Space Efficiency and Information Density Optimization: Advanced Circos implementations provide excellent frameworks for maximizing information density through efficient circular space utilization that accommodates multiple data layers while maintaining readability and interpretation capability. In my collaborative genomic research, I frequently employ Circos plots that integrate numerous data types within compact visualizations suitable for publication while preserving detailed information access through appropriate design optimization and hierarchical information organization.
Primary Limitations
• Circular Coordinate Interpretation and Distance Assessment: Circos plot interpretation can face challenges in accurate distance assessment and coordinate interpretation due to circular distortion effects that may create misleading impressions about genomic distances or regional relationships. I frequently encounter situations where circular representation distorts spatial relationships compared to linear genome coordinates, requiring careful annotation and supplementary linear views for accurate coordinate interpretation and quantitative distance assessment.
• Data Layer Complexity and Visual Overload: Circos effectiveness can be compromised by excessive data layer integration where visual complexity obscures rather than clarifies genomic patterns, potentially overwhelming viewers with information density that prevents effective pattern recognition. During collaborative multi-omics studies, I often observe how complex Circos plots with numerous data tracks create interpretation challenges that require careful layer selection and hierarchical design strategies to maintain biological insight communication while avoiding visual overload.
• Statistical Integration and Quantitative Analysis Limitations: While Circos plots effectively display genomic patterns, they provide limited frameworks for statistical annotation, significance testing, or quantitative comparison that may be essential for rigorous genomic analysis and hypothesis validation. I regularly encounter research contexts where Circos pattern observations require validation through formal statistical analysis and quantitative modeling that may not be easily integrated with circular visualization approaches without compromising visual clarity.
Effective Implementation in Genomic Research
Based on my extensive experience implementing Circos plots across diverse genomic contexts, I have developed systematic approaches that maximize their visualization value while addressing analytical limitations:
• Data Layer Selection and Hierarchical Organization: Systematic approaches to data layer selection, track organization, and visual hierarchy prove critical for generating interpretable Circos plots that effectively communicate genomic patterns while maintaining readability and biological focus. I consistently recommend prioritizing biologically relevant data layers, employing consistent color schemes and visual encoding, and implementing hierarchical track organization that guides viewer attention to key genomic features rather than attempting to display all available data simultaneously. The layer strategy should serve specific biological questions.
• Scale Normalization and Multi-Omics Integration: Careful attention to scale normalization, data transformation, and cross-omics integration proves essential for creating Circos plots that enable meaningful comparison across different genomic measurement types and experimental scales. In my multi-omics visualization work, I routinely employ appropriate normalization methods, scale standardization approaches, and integration strategies that preserve biological relationships while enabling visual comparison across diverse genomic data dimensions including expression, variation, and regulatory information.
• Statistical Annotation and Significance Integration: Sophisticated approaches to statistical overlay, significance annotation, and quantitative information integration enhance Circos plots by combining pattern visualization with analytical rigor while maintaining circular design aesthetics. I frequently employ subtle statistical annotations, confidence indicators, and significance tracks that complement genomic patterns while providing quantitative validation for visual observations without overwhelming primary visualization objectives.
• Interactive Features and Multi-Resolution Analysis: Complex genomic research often benefits from Circos implementations that incorporate interactive features including zooming capabilities, track filtering, and coordinated linear views that enable both genome-wide pattern recognition and detailed regional analysis. In my experience with large-scale genomic studies, I recommend approaches that enable user-driven exploration through multi-resolution viewing, coordinated visualization linking, and dynamic track selection while maintaining circular overview context for systems-level understanding.
Real Examples from Leading Genomic Research
The following examples from our curated collection demonstrate how leading researchers effectively implement Circos plots across diverse genomic contexts. Each plot represents peer-reviewed research from top-tier journals, showcasing sophisticated genomic visualization approaches that advance biological understanding.
Single-Cell Analysis and RNA Velocity Modeling
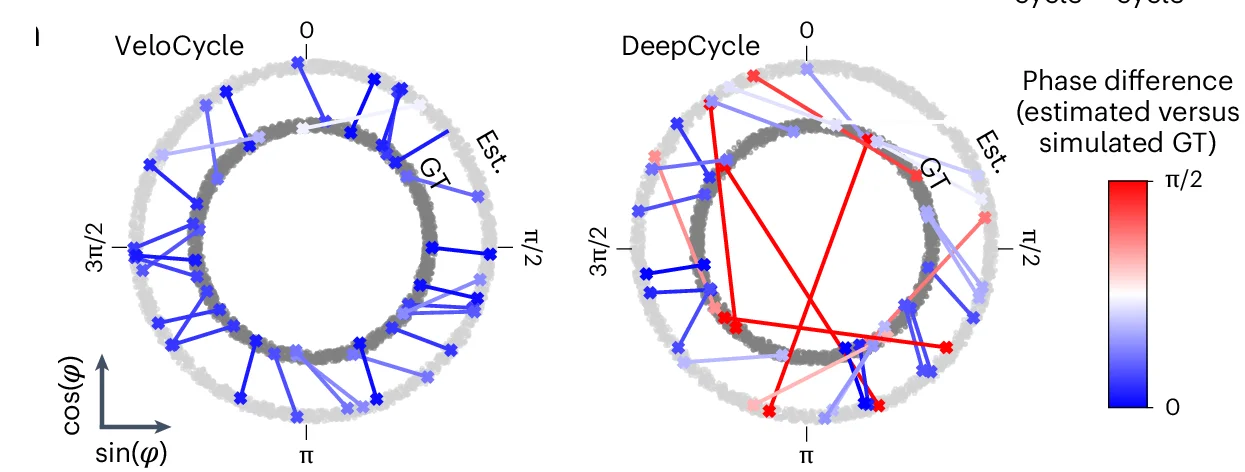
Statistical inference with manifold-constrained RNA velocity revealing cell cycle speed modulation networks - View full plot details
Single-cell genomics research demonstrates chord diagram excellence for velocity analysis. The Nature Methods publication investigating RNA velocity modeling (DOI: 10.1038/s41592-024-02471-8) employs chord diagrams to present cell state transition networks and velocity relationships. The visualization effectively reveals cell cycle dynamics while demonstrating speed modulation patterns that inform developmental biology and cell fate determination understanding.
Structural Biology and Protein Complex Assembly
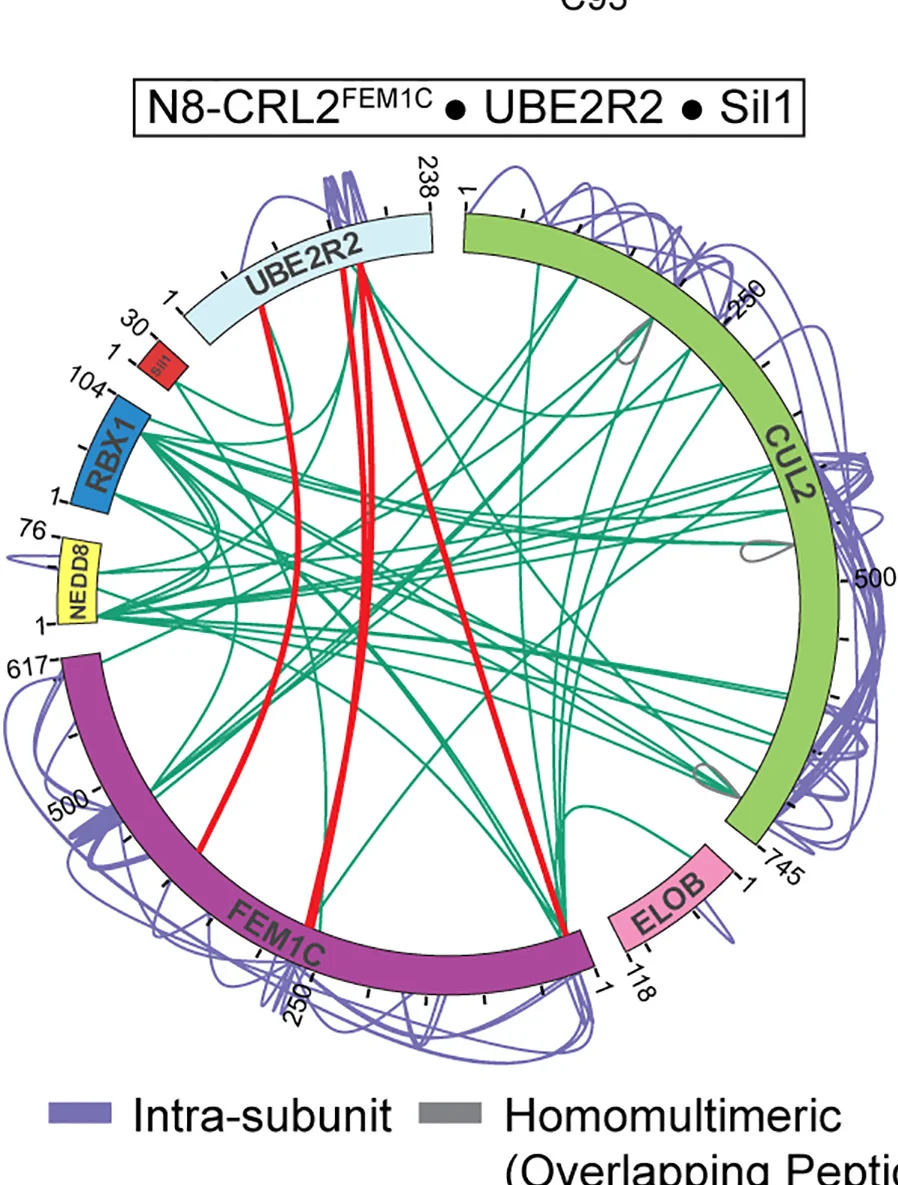
Cullin-RING ligase geometrically optimized catalytic partner networks for substrate targeting - View full plot details
Structural biology research showcases chord diagram applications for protein complex analysis. The Molecular Cell publication investigating Cullin-RING ligases (DOI: 10.1016/j.molcel.2024.01.022) uses chord diagrams to present protein interaction networks and catalytic partner relationships. The researchers effectively demonstrate geometric optimization while revealing substrate targeting mechanisms that inform ubiquitin system understanding and therapeutic development.
Neuroscience and Neural Network Connectivity
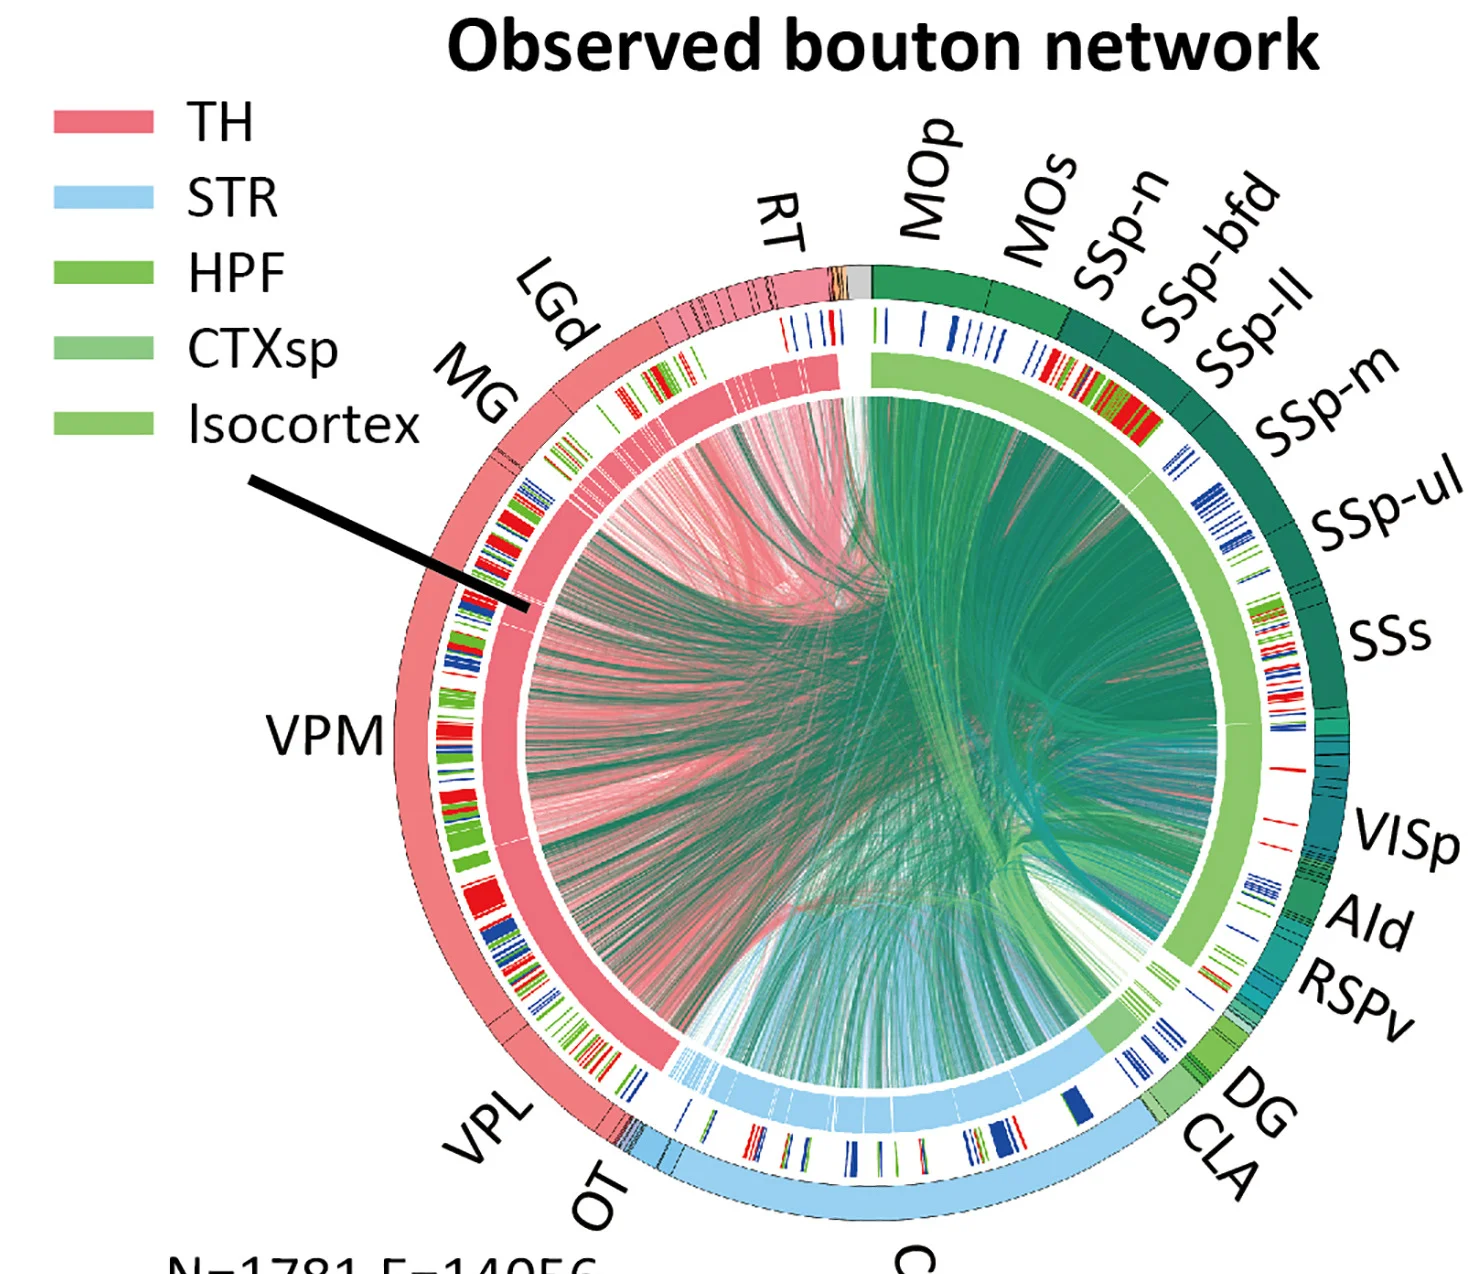
Non-homogenous axonal bouton distribution networks in whole-brain single-cell neuronal systems - View full plot details
Neuroscience research provides examples of chord diagram excellence in neural connectivity visualization. The Cell Reports publication investigating neuronal networks (DOI: 10.1016/j.celrep.2024.113871) employs chord diagrams to present axonal distribution networks and connectivity patterns. The visualization demonstrates bouton organization while revealing whole-brain connectivity principles that inform neural circuit understanding and brain mapping initiatives.
Cancer Biology and Mesenchymal Cell States

Distinct mesenchymal cell state networks mediating prostate cancer progression - View full plot details
Cancer biology research demonstrates sophisticated chord diagram implementation for tumor analysis. The Nature Communications publication investigating prostate cancer (DOI: 10.1038/s41467-023-44210-1) uses chord diagrams to present cell state transition networks and progression mechanisms. The researchers effectively reveal mesenchymal states while demonstrating transition pathways that inform cancer progression understanding and therapeutic target identification.
Single-Cell Cancer Analysis and Cellular Heterogeneity

Cancer cellular heterogeneity networks and mesenchymal cell state transitions - View full plot details
Single-cell cancer research showcases chord diagram applications for heterogeneity analysis. The Nature Communications publication investigating mesenchymal cancer states (DOI: 10.1038/s41467-023-44210-1) employs chord diagrams to present cellular transition networks and state relationships. The visualization demonstrates cancer heterogeneity while revealing state transition mechanisms that inform tumor progression and therapeutic resistance understanding.
Tumor Microenvironment and Cell-Cell Communication
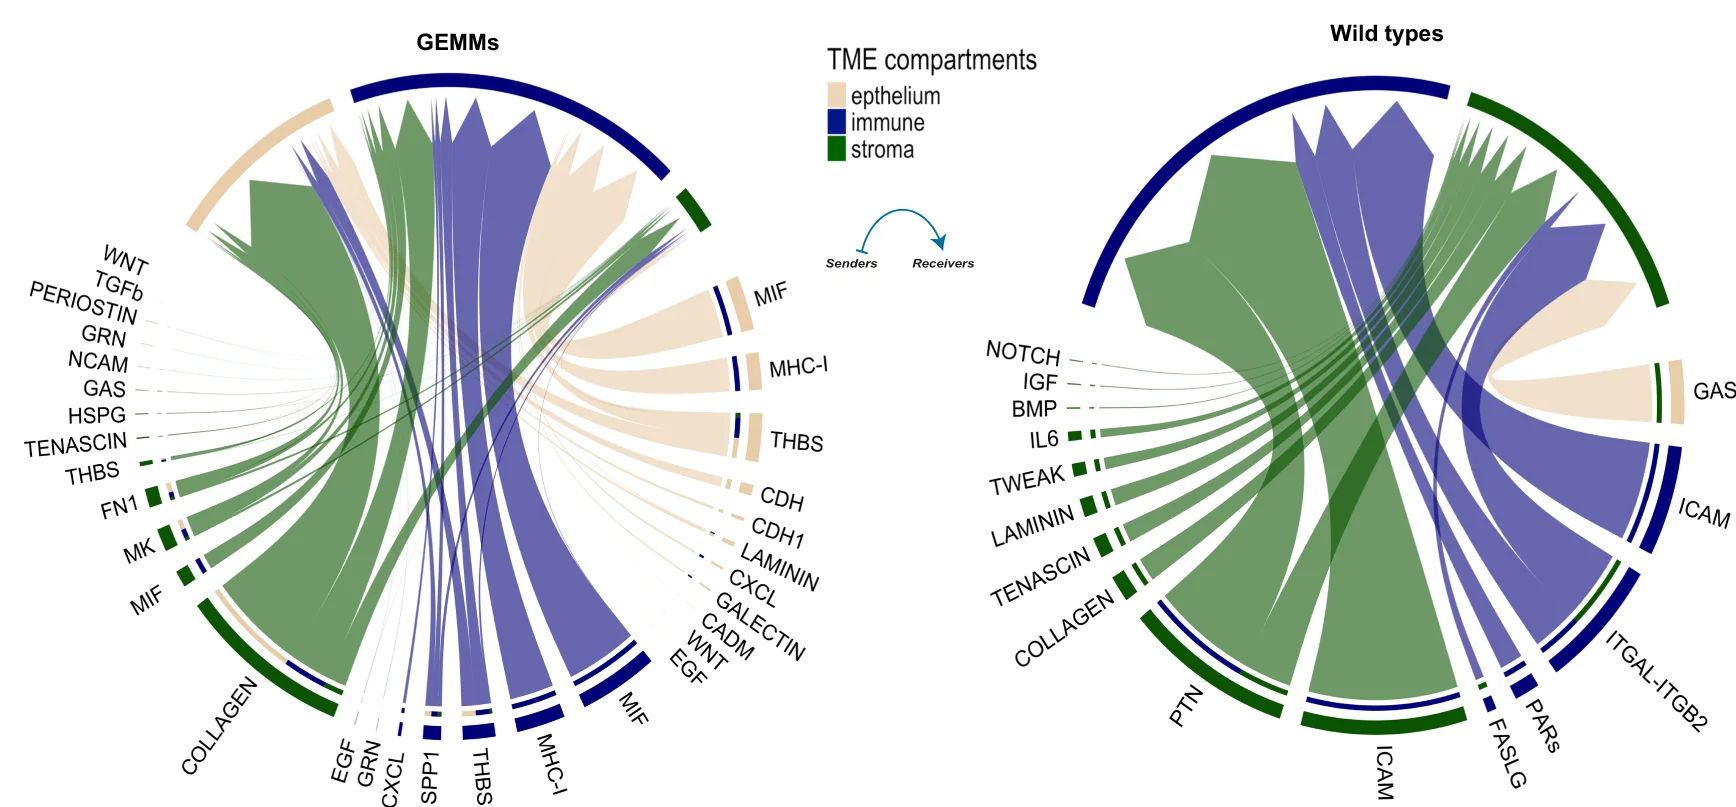
Tumor microenvironment cell-cell communication networks and mesenchymal progression pathways - View full plot details
Cancer microenvironment research demonstrates advanced chord diagram implementation for communication analysis. The Nature Communications publication investigating tumor progression (DOI: 10.1038/s41467-023-44210-1) uses chord diagrams to present intercellular communication networks and signaling pathways. The researchers effectively reveal microenvironment interactions while demonstrating communication mechanisms that drive cancer progression and therapeutic resistance development.
Maximizing Genomic Visualization Impact
Based on my extensive experience implementing Circos plots across diverse genomic research contexts, several key principles consistently distinguish exceptional genomic discoveries from merely comprehensive data displays:
• Biological Hypothesis Integration and Pattern Interpretation: The most effective Circos implementations combine comprehensive data integration with focused biological hypothesis testing that ensures genomic pattern recognition serves specific scientific questions rather than purely descriptive data presentation. I consistently recommend designing Circos visualizations around specific biological hypotheses, integrating functional annotation with pattern recognition, and connecting observed patterns with experimental validation opportunities while maintaining focus on mechanistic understanding rather than exhaustive data display.
• Multi-Scale Analysis and Hierarchical Understanding: Context-appropriate Circos implementation must integrate genome-wide patterns with regional detail analysis through hierarchical visualization approaches that enable both systems-level understanding and focused mechanistic investigation. In my collaborative genomic research, I emphasize approaches that provide multi-resolution analysis capabilities, coordinate circular overview with linear detail views, and integrate global patterns with local functional validation while ensuring that Circos insights drive targeted experimental follow-up and mechanistic investigation.
• Statistical Rigor and Quantitative Validation: Future-oriented Circos implementation will increasingly incorporate statistical validation frameworks, quantitative analysis integration, and reproducible analysis pipelines that ensure genomic pattern observations are supported by appropriate statistical evidence and can guide experimental validation efforts. However, the fundamental principles of focused biological questions, multi-scale integration, and mechanistic interpretation will continue to determine the difference between meaningful genomic insight and overwhelming data visualization that cannot support biological conclusions or experimental design.
Advancing Your Genomic Visualization Skills
The Circos plot examples featured in our curated collection represent the highest standards of genomic data integration and circular visualization, drawn from publications in Nature Genetics, Genome Biology, Cell, and other leading journals. Each example demonstrates effective integration of multiple genomic data types while advancing our understanding of genome organization and function through sophisticated circular visualization approaches.
My analysis of thousands of Circos implementations across diverse genomic research contexts has reinforced their critical importance for systems-level genomic understanding and multi-omics integration that drives functional genomics discovery and evolutionary insight generation. When implemented thoughtfully with attention to biological focus, statistical rigor, and mechanistic interpretation, Circos plots transform complex genomic datasets into comprehensive understanding that advances genomic science and precision medicine applications.
I encourage genomic researchers to explore our complete curated collection of Circos plot examples, where you can discover additional high-quality genomic visualizations from cutting-edge research across multiple genomic contexts and analytical approaches. Each plot includes comprehensive methodology documentation and interpretation guidance, enabling you to adapt proven genomic visualization approaches to your own research challenges and multi-omics integration objectives.
Want to explore more examples of professional Circos plot implementation from top-tier genomic research publications? Check out our curated collection at: Network - featuring dozens of publication-quality genomic analyses from Nature Genetics, Genome Biology, and other leading journals, each with complete methodology details and genomic interpretation frameworks.
Related Articles

Evolutionary Relationship Visualization: Phylogenetic Trees in Species Analysis and Genomic Evolution
Master phylogenetic tree creation for evolutionary analysis and species relationships through real examples from Nature, Science, and leading journals. Learn tree topology, branch lengths, and evolutionary inference.
Distribution Comparison Excellence: Ridgeline Plots in Density Analysis and Group Comparison
Master ridgeline plot creation for distribution comparison and density visualization through real examples from Nature, Cell, and leading journals. Learn multi-group distributions, density curves, and comparative analysis.
Hierarchical Composition Analysis: Treemaps in Data Structure Visualization
Master treemap creation for hierarchical data visualization and compositional analysis through real examples from Nature, Cell, and leading journals. Learn nested visualization, space-filling techniques, and hierarchical proportions.