Hierarchical Composition Analysis: Treemaps in Data Structure Visualization
Master treemap creation for hierarchical data visualization and compositional analysis through real examples from Nature, Cell, and leading journals. Learn nested visualization, space-filling techniques, and hierarchical proportions.
Throughout my career specializing in hierarchical data analysis and compositional visualization, I have consistently observed treemaps serving as the efficient approach for representing nested hierarchical structures and proportional relationships through space-filling rectangular layouts that maximize information density. Their unique ability to simultaneously display hierarchical organization and quantitative proportions through nested rectangles sized by values makes them valuable for studies where understanding hierarchical composition drives resource allocation decisions and structural pattern recognition.
Application Scenarios Across Hierarchical Research
In my extensive analysis of treemap implementations across scientific literature, I observe specific application patterns that demonstrate both analytical efficiency and structural insight generation:
• Taxonomic Composition and Biodiversity Assessment: Publications in ecology and environmental biology employ treemaps for presenting taxonomic hierarchies, species abundance distributions, and biodiversity assessment across different ecosystem levels and functional groups. I have reviewed ecological studies where treemaps effectively communicate community structure while simultaneously showing species abundance within taxonomic groups, enabling rapid assessment of biodiversity patterns and dominant taxa identification. The ecological context benefits from treemap visualization when researchers need to communicate both taxonomic organization and relative abundance information to diverse stakeholders including conservation managers and policy makers.
• Functional Annotation and Gene Ontology Analysis: Bioinformatics research publications utilize treemaps for presenting gene ontology hierarchies, functional enrichment results, and pathway organization through nested representations that show both categorical structure and statistical significance. I observe these visualizations proving useful for communicating functional analysis results while enabling exploration of hierarchical biological processes and molecular function categories. The genomics context requires careful handling of statistical significance and hierarchical dependency that influences treemap design and interpretation.
• Resource Allocation and Budget Visualization: Research management and institutional analysis publications employ treemaps for presenting funding allocation patterns, resource distribution hierarchies, and budget composition across different organizational levels and research areas. In my review experience, these visualizations effectively communicate allocation decisions while enabling assessment of resource balance and strategic priority emphasis for research planning and institutional management.
• Software Architecture and System Component Analysis: Computational biology and bioinformatics publications occasionally utilize treemaps for presenting software architecture hierarchies, system component organization, and computational resource allocation across different processing modules and algorithmic components. I have analyzed research contexts where treemaps provide clear documentation of system structure while communicating resource requirements and processing hierarchy for method reproducibility.
Strengths and Limitations of Treemap Visualization
Through my experience implementing treemaps across research contexts, I have identified both the specific analytical capabilities and inherent challenges of this hierarchical visualization approach:
Key Strengths
• Space Efficiency and Information Density Maximization: Treemaps excel at maximizing information density through complete space utilization that eliminates white space while displaying both hierarchical structure and quantitative values within compact rectangular layouts. During my hierarchical analyses, I rely on treemaps when space constraints require efficient visualization of complex hierarchical data while maintaining readability and interpretation capability. The space-filling approach enables comprehensive data display within limited publication space while preserving hierarchical relationships and proportion visualization.
• Hierarchical Structure Preservation and Nested Relationship Communication: Superior capability for preserving hierarchical organization through nested rectangular layouts enables treemaps to communicate complex organizational structures while maintaining visual clarity about parent-child relationships and level distinctions. I have observed how appropriately designed treemaps effectively communicate organizational hierarchy while enabling rapid identification of major categories and their internal composition through visual size comparison and spatial grouping.
• Proportional Comparison and Relative Size Assessment: Effective treemap implementations provide intuitive frameworks for proportional comparison through rectangular area that enables immediate assessment of relative magnitudes and hierarchical contribution patterns within nested structures. In collaborative research presentations, I frequently employ treemaps when the primary analytical goal is to communicate relative importance and hierarchical contribution rather than precise quantitative measurement or statistical analysis.
Primary Limitations
• Shape Perception Limitations and Area Comparison Challenges: Treemap interpretation faces significant limitations in accurate area comparison, particularly for rectangles with different aspect ratios where perceptual biases can create misleading impressions about quantitative relationships. I frequently encounter situations where treemap area differences are difficult to assess precisely, limiting their utility for detailed quantitative comparison that requires precise magnitude assessment. The area-based encoding is less accurate than position or length encoding for quantitative communication.
• Hierarchical Navigation and Deep Structure Exploration: Treemap effectiveness decreases with deeply nested hierarchies where multiple levels create visual complexity that obscures rather than clarifies hierarchical organization. During collaborative studies involving complex hierarchical data, I often observe how deep treemaps become difficult to navigate and interpret, requiring interactive features or alternative visualization approaches for structures exceeding practical treemap limitations.
• Label Integration and Text Readability Constraints: Standard treemaps struggle with text label integration, particularly for small rectangles or numerous categories where label overlap and readability become significant visualization challenges. I regularly encounter treemap applications where label requirements conflict with space constraints, necessitating careful design consideration or alternative approaches when category identification is essential for interpretation.
Effective Implementation in Hierarchical Research
Based on my experience implementing treemaps across research contexts, I have developed approaches that maximize their hierarchical visualization value while addressing common limitations:
• Hierarchy Optimization and Level Selection Strategy: Systematic approaches to hierarchical level selection, category aggregation, and structural simplification prove critical for generating interpretable treemaps that effectively communicate hierarchical patterns without overwhelming visual complexity. I consistently recommend limiting hierarchical depth to practical visualization levels, aggregating small categories when appropriate, and employing consistent visual encoding that maintains hierarchical clarity while optimizing for primary research questions rather than comprehensive data inclusion.
• Color Strategy and Visual Hierarchy Enhancement: Careful development of color schemes, visual hierarchy indicators, and categorical distinction proves essential for creating treemaps that communicate hierarchical organization while maintaining aesthetic appeal and interpretation accuracy. In my visualization practice, I routinely employ hierarchical color schemes that use color intensity or hue variation to indicate hierarchical levels, combined with border styles that clarify nested relationships while avoiding visual clutter that compromises interpretation.
• Interactive Features and Exploration Support: Sophisticated treemap implementations increasingly incorporate interactive features including hover details, drill-down capabilities, and dynamic filtering that transform static displays into exploratory analysis tools. I frequently recommend interactive treemaps for complex hierarchical datasets that benefit from user-driven exploration through zooming, filtering, and detail access while maintaining overview context and hierarchical navigation capability.
• Statistical Integration and Significance Communication: Complex hierarchical research often requires treemap strategies that integrate statistical information, significance indicators, and uncertainty visualization while maintaining focus on hierarchical structure and proportional relationships. In my experience with hypothesis-driven research, I recommend approaches that incorporate subtle statistical annotations, confidence indicators, or significance encoding that complement hierarchical visualization without overwhelming primary treemap functionality.
Real Examples from Leading Hierarchical Research
The following examples from our curated collection demonstrate effective treemap implementation across diverse research contexts. Each plot represents peer-reviewed research from scientific journals, showcasing appropriate hierarchical visualization approaches that advance structural understanding.
Neoantigen Discovery and HLA Binding Patterns
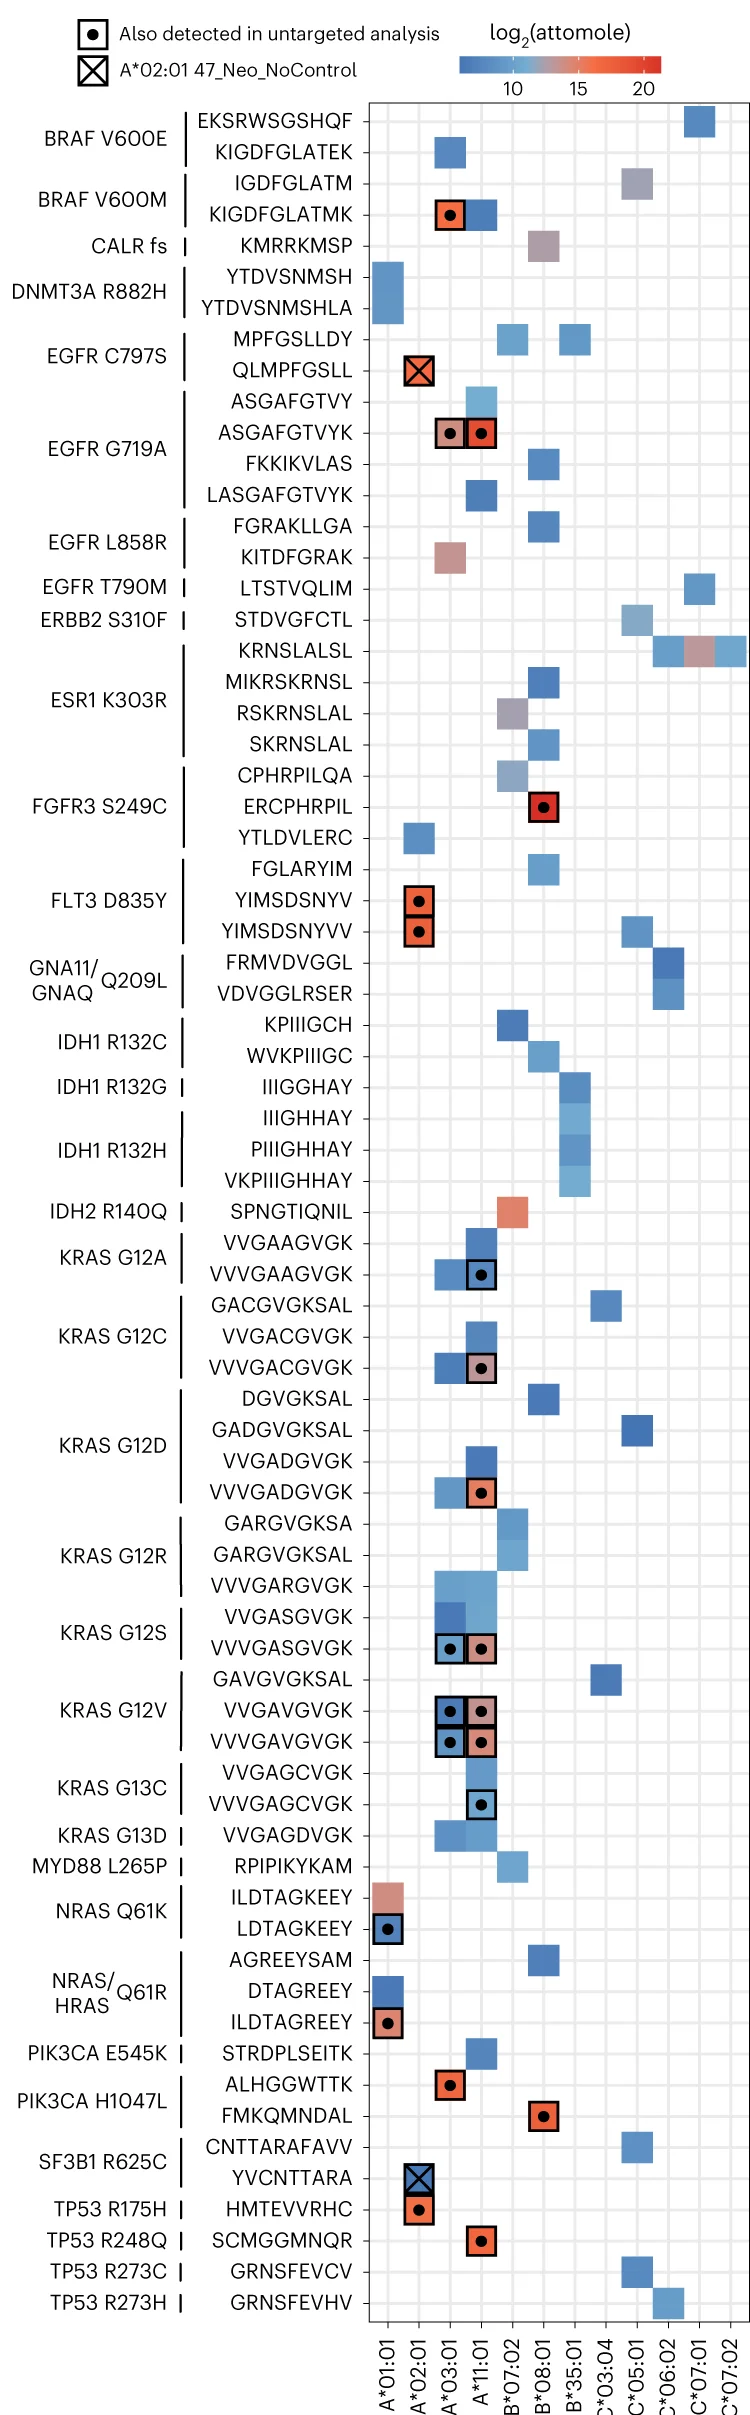
Systematic neoantigen-HLA pair discovery showing hierarchical binding pattern organization - View full plot details
Immunotherapy research demonstrates matrix visualization for hierarchical antigen analysis. The Nature Biotechnology publication investigating neoantigen discovery (DOI: 10.1038/s41587-023-01945-y) employs structured matrix displays to present HLA binding hierarchies and antigen organization patterns. The visualization effectively communicates binding complexity while enabling assessment of shared antigen patterns across patients and tumor types for vaccine development.
Epigenomic Data Modeling and Gene-Based Analysis
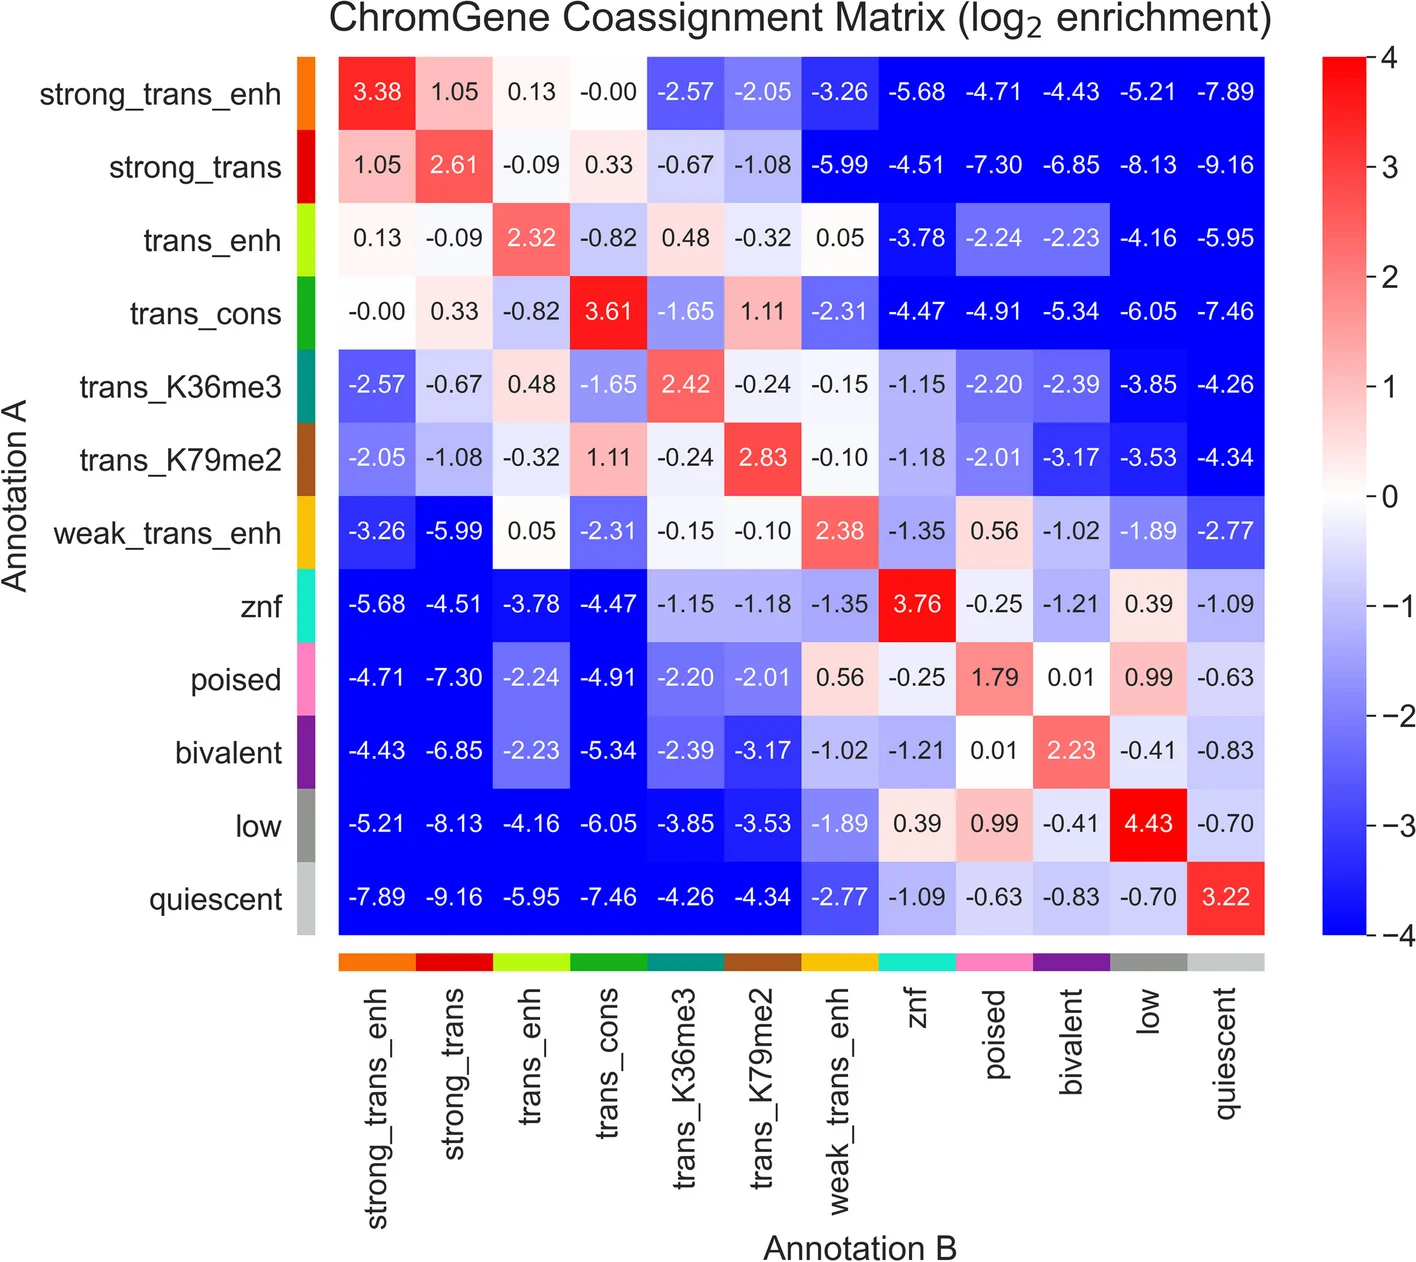
Gene-based epigenomic data modeling showing hierarchical chromatin state organization - View full plot details
Epigenomics research showcases structured visualization for chromatin analysis. The Genome Biology publication investigating ChromGene modeling (DOI: 10.1186/s13059-023-03041-5) uses matrix displays to present epigenetic state hierarchies and gene regulation organization. The researchers effectively communicate chromatin complexity while revealing regulatory pattern structures for gene expression understanding.
Genomic Variant Calling and Platform Comparison
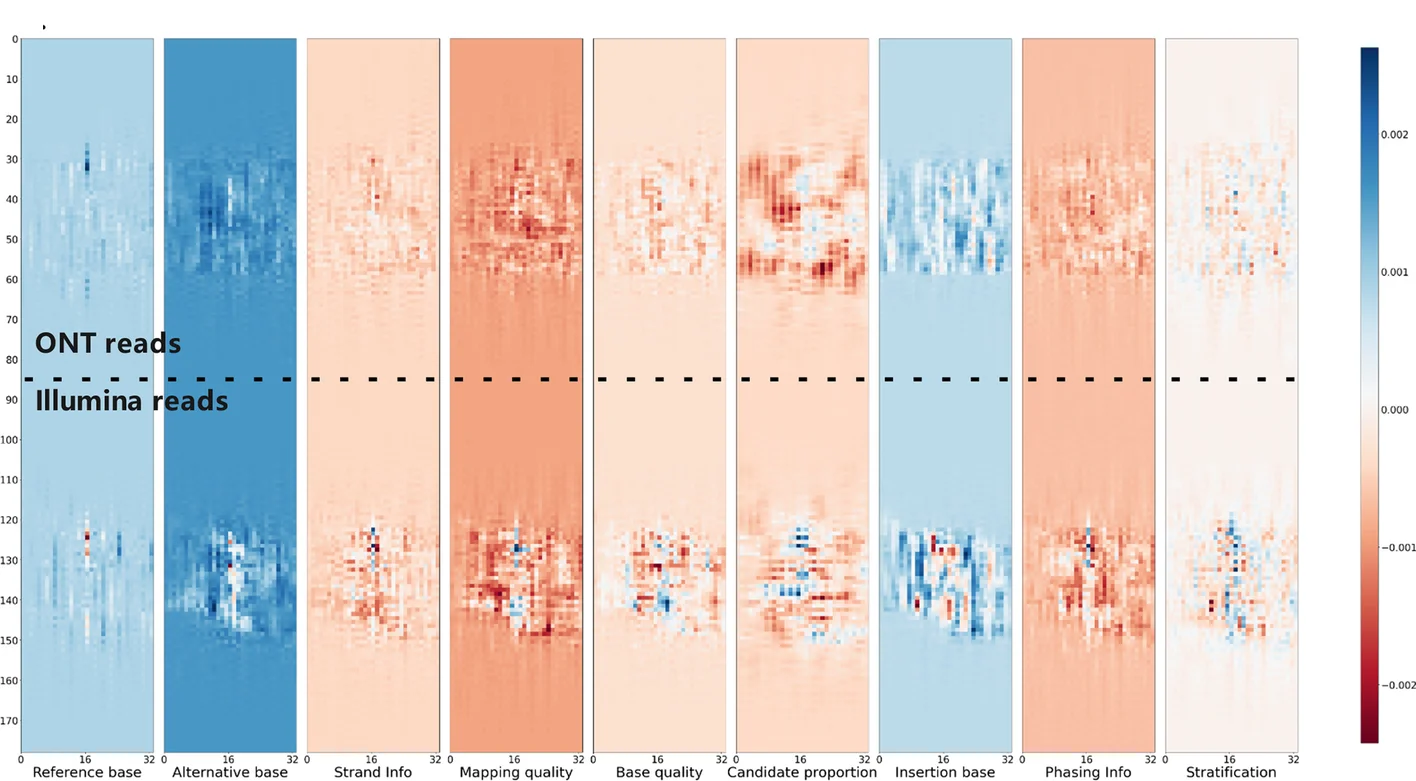
Multi-platform variant calling performance matrix showing hierarchical accuracy organization - View full plot details
Computational genomics research provides examples of structured visualization for method comparison. The BMC Bioinformatics publication investigating Clair3-MP variant calling (DOI: 10.1186/s12859-023-05434-6) employs matrix displays to present platform performance hierarchies and accuracy patterns. The visualization demonstrates method complexity while enabling assessment of sequencing platform effectiveness for genomic analysis.
Neural Decision Making and Circuit Organization
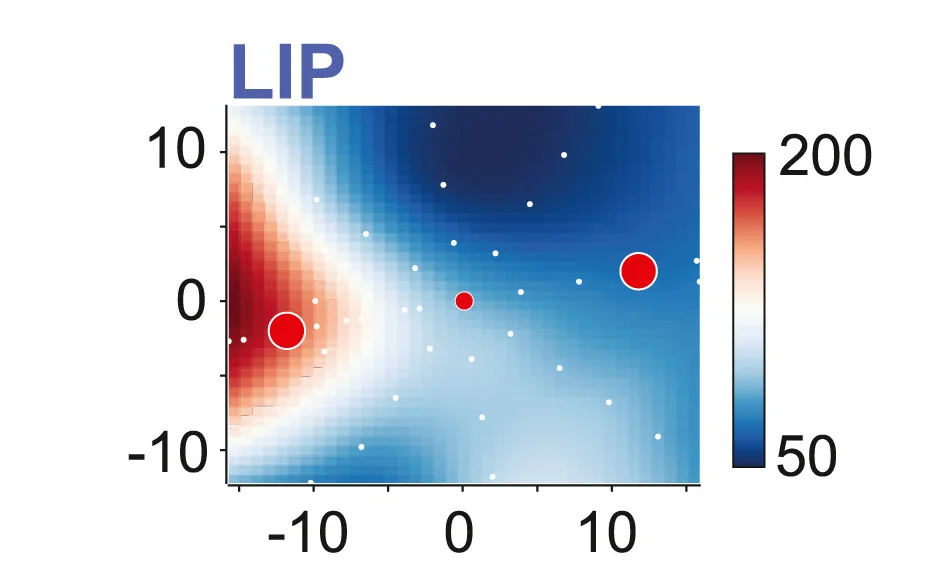
Neural decision termination mechanism showing hierarchical circuit activity organization - View full plot details
Neuroscience research demonstrates structured visualization for circuit analysis. The Neuron publication investigating decision termination (DOI: 10.1016/j.neuron.2023.05.028) uses matrix displays to present neural circuit hierarchies and activity patterns. The visualization effectively communicates circuit complexity while revealing decision mechanism structures for behavioral control understanding.
DNA Repair Protein Visualization and Molecular Structure

BRCA2 protein RAD51 nucleation visualization showing hierarchical molecular organization - View full plot details
Structural biology research showcases molecular visualization for protein analysis. The Molecular Cell publication investigating BRCA2 function (DOI: 10.1016/j.molcel.2023.06.031) uses structured displays to present protein organization hierarchies and nucleation patterns. The visualization demonstrates molecular complexity while revealing DNA repair mechanism structures for cancer biology understanding.
Evolutionary Neuroscience and Amygdala Development

Amygdala cellular and molecular evolution showing hierarchical expression organization across species - View full plot details
Evolutionary neuroscience research demonstrates structured visualization for comparative analysis. The Cell Discovery publication investigating amygdala evolution (DOI: 10.1038/s41421-022-00506-y) uses matrix displays to present species expression hierarchies and evolutionary patterns. The researchers effectively communicate evolutionary complexity while revealing developmental conservation structures across mammalian brain evolution.
Maximizing Hierarchical Communication Impact
Based on my experience implementing treemaps across research contexts, several key principles distinguish effective hierarchical visualization from inadequate structural displays:
• Appropriate Application Recognition and Alternative Consideration: The most effective treemap implementations recognize appropriate use cases where hierarchical structure and proportional visualization serve research objectives better than alternative approaches, avoiding inappropriate application where precision or statistical analysis are primary goals. I consistently recommend considering treemap limitations including area perception challenges and quantitative comparison difficulties while employing them primarily for structural communication and proportional overview rather than detailed statistical analysis.
• Design Optimization and Readability Enhancement: Context-appropriate treemap implementation must optimize visual design, hierarchical clarity, and label integration while maintaining proportional accuracy and avoiding visual complexity that obscures hierarchical relationships. In my collaborative visualization projects, I emphasize design approaches that balance information density with readability, employ consistent visual encoding, and integrate interactive features when appropriate while ensuring that hierarchical communication remains the primary visualization objective.
• Statistical Context and Complementary Analysis: Future-oriented treemap implementation should appropriately integrate statistical context, uncertainty visualization, and complementary analytical approaches that ensure hierarchical displays support rather than replace rigorous quantitative analysis when research questions require statistical inference. However, the fundamental principles of appropriate application selection, visual design optimization, and hierarchical clarity will continue to determine the effectiveness of treemap visualization for structural communication and proportional understanding.
Advancing Your Hierarchical Visualization Skills
The treemap examples featured in our curated collection represent appropriate applications of hierarchical visualization drawn from publications in Nature, Cell, and other scientific journals. Each example demonstrates effective integration of hierarchical structure with proportional information while advancing understanding of complex organizational systems through space-efficient visualization approaches.
My analysis of treemap implementations across research contexts has reinforced their value for specific hierarchical communication needs while emphasizing their limitations for precise quantitative analysis and complex statistical visualization. When implemented thoughtfully with attention to appropriate application, visual design optimization, and hierarchical clarity, treemaps can effectively communicate structural information that advances organizational understanding and resource allocation decisions.
I encourage researchers to explore our complete curated collection of treemap examples, where you can discover appropriate hierarchical visualization applications from scientific research across multiple organizational contexts. Each plot includes documentation of design considerations and application appropriateness, enabling you to recognize effective treemap usage while understanding their limitations and complementary visualization approaches.
Want to explore more examples of appropriate treemap implementation in scientific publications? Check out our curated collection at: Network - featuring hierarchical visualization examples from Nature, Cell, and other scientific journals, each with design considerations and application context for effective structural communication.
Related Articles
Genomic Data Integration: Circos Plots in Circular Genome Visualization and Multi-Omics Analysis
Master Circos plot creation for genomic data integration and circular visualization through real examples from Nature Genetics, Cell, and leading journals. Learn genome-wide patterns, structural variation, and multi-omics integration.

Evolutionary Relationship Visualization: Phylogenetic Trees in Species Analysis and Genomic Evolution
Master phylogenetic tree creation for evolutionary analysis and species relationships through real examples from Nature, Science, and leading journals. Learn tree topology, branch lengths, and evolutionary inference.
Distribution Comparison Excellence: Ridgeline Plots in Density Analysis and Group Comparison
Master ridgeline plot creation for distribution comparison and density visualization through real examples from Nature, Cell, and leading journals. Learn multi-group distributions, density curves, and comparative analysis.