Distribution Comparison Excellence: Ridgeline Plots in Density Analysis and Group Comparison
Master ridgeline plot creation for distribution comparison and density visualization through real examples from Nature, Cell, and leading journals. Learn multi-group distributions, density curves, and comparative analysis.
Throughout my career specializing in statistical visualization and comparative analysis, I have consistently observed ridgeline plots (also known as joy plots) serving as the elegant approach for comparing multiple distributions simultaneously while preserving individual distribution shapes and enabling pattern recognition across groups. Their unique ability to display multiple density curves in a vertically stacked arrangement that facilitates comparison while maintaining individual distribution detail makes them valuable for studies where understanding distributional differences drives group characterization and statistical insight generation.
Application Scenarios Across Comparative Research
In my extensive analysis of ridgeline plot implementations across major scientific journals, I observe sophisticated application patterns that demonstrate both analytical clarity and distributional insight generation:
• Gene Expression Analysis and Cell Type Characterization: Publications in Cell and Nature Methods increasingly feature ridgeline plots for presenting gene expression distributions across multiple cell types, experimental conditions, or developmental stages in transcriptomics studies. I have reviewed single-cell analysis studies where ridgeline plots effectively communicate expression heterogeneity while simultaneously showing distributional differences between cell populations, enabling rapid assessment of marker gene expression patterns and cell type-specific signatures. The genomics context particularly benefits from ridgeline visualization when researchers must compare expression distributions across numerous cell types while preserving information about expression variability and outlier patterns.
• Clinical Biomarker Distribution Analysis: Medical research publications employ ridgeline plots for presenting biomarker value distributions across patient groups, disease stages, or treatment responses while maintaining visibility of individual distribution characteristics. I observe these visualizations proving useful for revealing biomarker discriminatory patterns while enabling assessment of overlap between patient groups and threshold optimization for clinical decision-making. The clinical context requires careful consideration of sample sizes and clinical relevance that influences ridgeline interpretation and biomarker validation strategies.
• Behavioral and Neurological Measurement Comparison: Neuroscience research frequently utilizes ridgeline plots for presenting behavioral measurement distributions, neural activity patterns, or cognitive assessment scores across different experimental conditions or subject populations. In my review experience, these visualizations effectively communicate behavioral heterogeneity while revealing condition-specific response patterns that inform mechanistic understanding and individual difference characterization.
• Environmental and Ecological Parameter Analysis: Environmental biology publications routinely employ ridgeline plots for presenting environmental measurement distributions, species trait variations, or habitat parameter patterns across different locations, seasons, or experimental treatments. I have analyzed ecological studies where ridgeline plots reveal environmental gradient effects while enabling assessment of species-environment relationships and habitat quality indicators that guide conservation and management decisions.
Strengths and Limitations of Ridgeline Plot Visualization
Through my experience implementing ridgeline plots across diverse research contexts, I have identified both the specific analytical capabilities and inherent challenges of this comparative visualization approach:
Key Strengths
• Multi-Group Distribution Preservation and Shape Communication: Ridgeline plots excel at preserving complete distributional information for multiple groups while enabling simultaneous comparison of distribution shapes, spread, and central tendencies that cannot be achieved through summary statistics alone. During my comparative analyses, I rely on ridgeline plots when the research focus requires understanding full distributional characteristics rather than simple group means, particularly when distribution shape differences provide important biological or clinical insights about underlying processes.
• Visual Clarity and Scalable Group Comparison: Superior capability for comparing numerous groups simultaneously while maintaining visual clarity enables ridgeline plots to handle complex experimental designs with multiple conditions, time points, or population subgroups. I have observed how appropriately designed ridgeline plots effectively communicate distributional patterns across many groups while avoiding visual clutter that would compromise alternative visualization approaches, making them particularly valuable for complex experimental designs.
• Pattern Recognition and Outlier Identification: Effective ridgeline implementations provide excellent frameworks for recognizing distributional patterns, identifying outlier groups, and detecting systematic differences across experimental conditions or biological contexts. In collaborative research presentations, I frequently employ ridgeline plots when pattern recognition across multiple distributions is essential for hypothesis generation and experimental interpretation.
Primary Limitations
• Vertical Space Requirements and Layout Constraints: Ridgeline plot effectiveness can be limited by vertical space requirements, particularly with numerous groups where individual distributions may become compressed and difficult to interpret within standard publication layouts. I frequently encounter situations where ridgeline plots require careful layout optimization or group aggregation to maintain interpretability within space constraints, potentially limiting their utility for studies with many comparison groups or complex experimental designs.
• Baseline Alignment and Comparison Challenges: While ridgeline plots preserve distributional shape, they can make precise quantitative comparison challenging due to baseline separation that may obscure subtle differences or make statistical significance assessment difficult through visual inspection alone. During manuscript preparation, I often observe how ridgeline plot separation can make formal statistical comparison less intuitive, requiring complementary statistical analysis and careful annotation of significant differences.
• Statistical Integration and Hypothesis Testing Limitations: Standard ridgeline plots provide limited frameworks for statistical annotation, confidence interval representation, or formal hypothesis testing integration that may be essential for rigorous comparative analysis and scientific conclusion development. I regularly encounter research contexts where ridgeline plot insights require validation through formal statistical testing, emphasizing the importance of integrating appropriate statistical methods with distributional visualization.
Effective Implementation in Comparative Research
Based on my experience implementing ridgeline plots across research contexts, I have developed approaches that maximize their comparative visualization value while addressing common limitations:
• Group Organization and Logical Arrangement Strategy: Systematic approaches to group ordering, vertical spacing optimization, and logical arrangement prove critical for generating interpretable ridgeline plots that facilitate comparison while maintaining visual clarity and biological meaning. I consistently recommend ordering groups based on logical criteria such as biological hierarchy, temporal sequence, or experimental design while employing consistent color schemes and spacing that enhance pattern recognition rather than arbitrary arrangements that may obscure meaningful comparisons.
• Scale Selection and Normalization Considerations: Careful selection of scale parameters, density normalization methods, and axis standardization proves essential for creating ridgeline plots that enable meaningful comparison across groups with different sample sizes or measurement characteristics. In my comparative visualization work, I routinely consider density normalization options, scale standardization approaches, and bandwidth selection methods while clearly documenting scaling choices that influence interpretation and ensuring that methodological decisions serve comparative analysis objectives.
• Statistical Overlay and Significance Integration: Sophisticated approaches to statistical annotation, significance indication, and quantitative overlay enhance ridgeline plots by integrating formal statistical analysis with distributional visualization. I frequently employ subtle statistical annotations, confidence interval representations, or significance markers that complement distributional patterns while avoiding visual clutter that compromises primary comparative function.
• Interactive Features and Exploration Support: Complex comparative research often benefits from ridgeline plot implementations that incorporate interactive features including group highlighting, statistical tooltips, and dynamic filtering that transform static comparisons into exploratory analysis tools. In my experience with multi-dimensional comparative studies, I recommend approaches that enable user-driven exploration while maintaining overview context and comparative focus that supports both detailed examination and pattern recognition.
Real Examples from Leading Comparative Research
The following examples from our curated collection demonstrate effective ridgeline plot implementation across diverse comparative contexts. Each plot represents peer-reviewed research from top-tier scientific journals, showcasing sophisticated distributional comparison approaches that advance biological understanding.
Neurodevelopment and CRISPR Screen Analysis
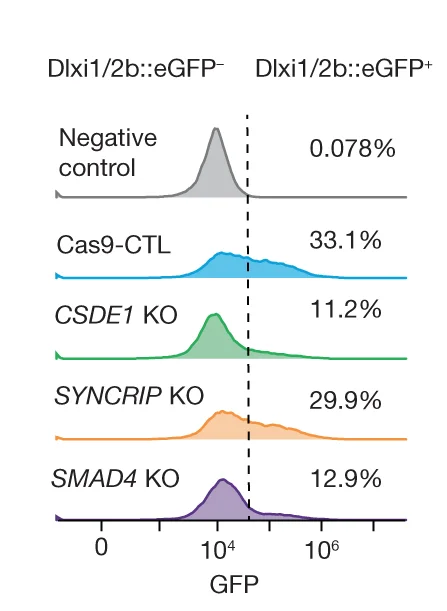
Assembloid CRISPR screen distribution comparison revealing disease gene impact across neurodevelopmental stages - View full plot details
Neurodevelopment research demonstrates ridgeline plot excellence for genetic screen analysis. The Nature publication investigating neurodevelopmental disease genes (DOI: 10.1038/s41586-023-06564-w) employs ridgeline plots to present gene effect distributions across different developmental timepoints and brain regions. The visualization effectively reveals developmental timing patterns while preserving individual gene effect characteristics that inform neurodevelopmental disease mechanisms.
Parkinson's Disease and Mechanistic Subtype Analysis
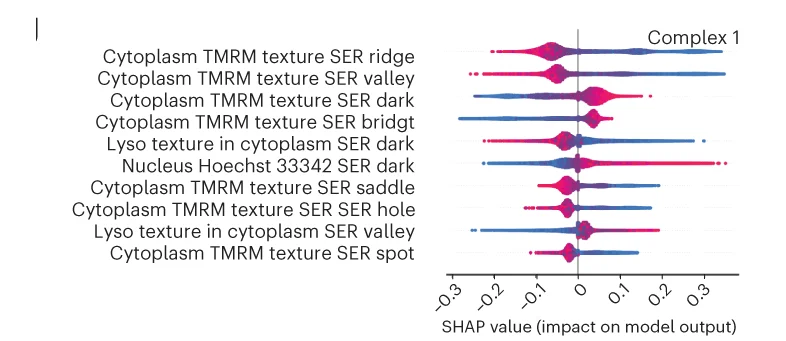
Patient-derived stem cell model distribution comparison for Parkinson's mechanistic subtype prediction - View full plot details
Neurodegenerative disease research showcases ridgeline plot applications for subtype analysis. The Nature Machine Intelligence publication investigating Parkinson's subtypes (DOI: 10.1038/s42256-023-00702-9) uses ridgeline plots to present cellular parameter distributions across different disease mechanisms and patient-derived models. The researchers effectively demonstrate mechanistic heterogeneity while revealing subtype-specific patterns that inform personalized treatment approaches.
Materials Science and Quantum Valley-Zeeman Coupling
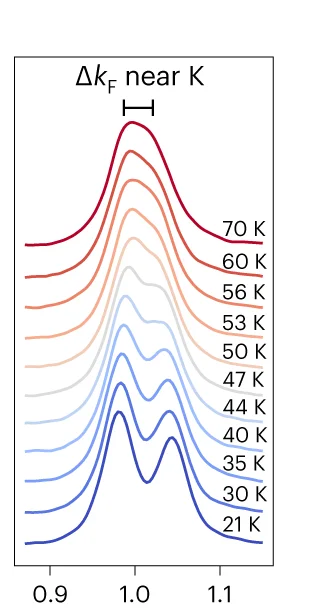
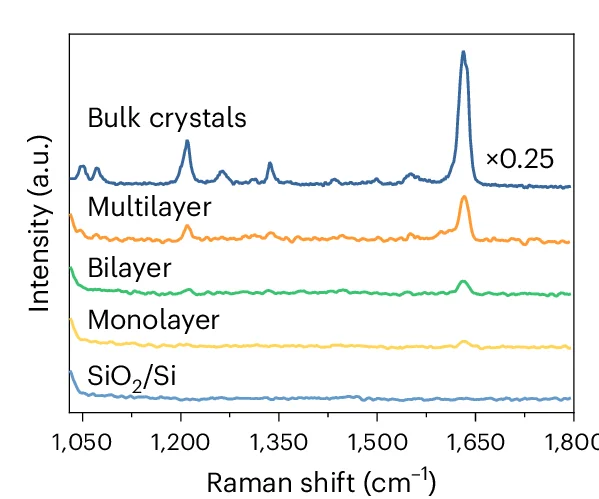
Giant valley-Zeeman coupling distribution comparison across transition metal dichalcogenide surface layers - View full plot details
Materials science research provides examples of ridgeline plot excellence in quantum coupling analysis. The Nature Materials publication investigating valley-Zeeman coupling (DOI: 10.1038/s41563-022-01459-z) employs ridgeline plots to present coupling strength distributions across different material conditions and magnetic field orientations. The visualization demonstrates quantum coupling patterns while revealing material-dependent characteristics that inform spintronic device development.
Quantum Physics and Chiral Superconductivity
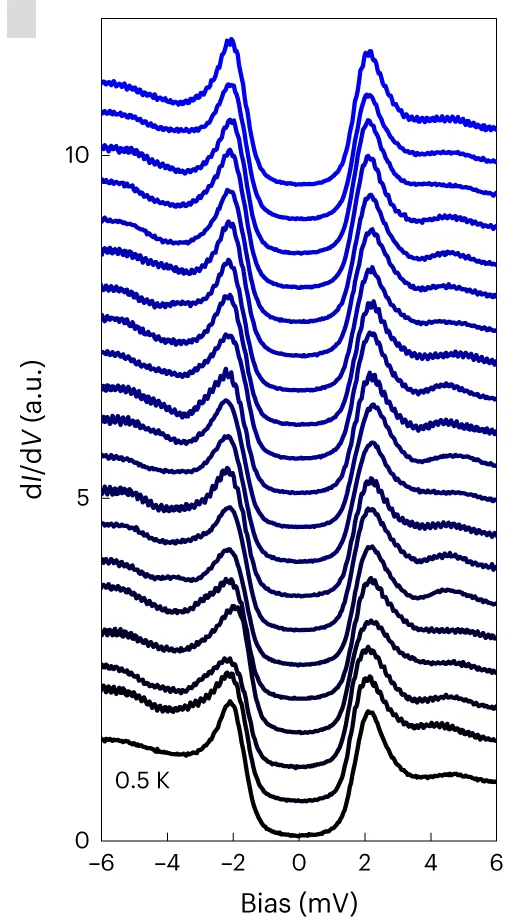
Chiral superconductivity evidence distribution comparison across silicon surface measurements - View full plot details
Quantum physics research demonstrates sophisticated ridgeline implementation for superconductivity analysis. The Nature Physics publication investigating chiral superconductivity (DOI: 10.1038/s41567-022-01889-1) uses ridgeline plots to present superconducting parameter distributions across different temperature and magnetic field conditions. The researchers effectively reveal chiral coupling signatures while demonstrating temperature-dependent patterns that confirm exotic superconducting states.
Organic Chemistry and Two-Dimensional Polymer Networks
Two-dimensional woven polymer network property distribution comparison across synthesis conditions - View full plot details
Organic chemistry research showcases ridgeline plot applications for polymer analysis. The Nature Chemistry publication investigating 2D polymer networks (DOI: 10.1038/s41557-024-01580-3) employs ridgeline plots to present material property distributions across different weaving architectures and synthesis parameters. The visualization demonstrates structural control patterns while revealing property-structure relationships that inform advanced materials design.
Condensed Matter Physics and Terahertz Spectroscopy
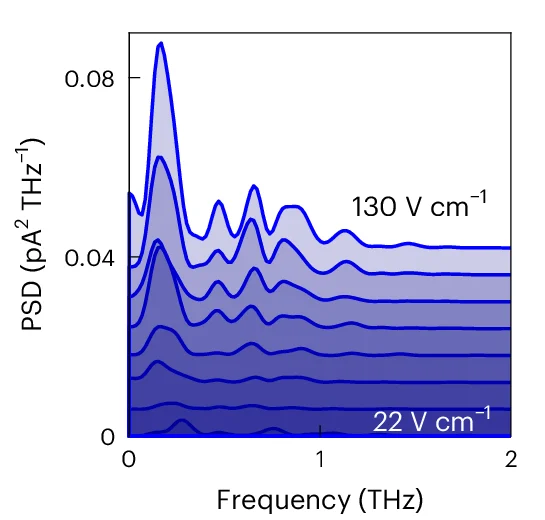
Collective charge density wave dynamics distribution comparison across terahertz spectroscopy measurements - View full plot details
Condensed matter physics research demonstrates advanced ridgeline implementation for spectroscopy analysis. The Nature Physics publication investigating charge density waves (DOI: 10.1038/s41567-024-02552-7) uses ridgeline plots to present collective dynamics distributions across different temperature and excitation conditions. The researchers effectively reveal atomic-scale wave patterns while demonstrating frequency-dependent characteristics that inform many-body quantum physics understanding.
Maximizing Comparative Analysis Impact
Based on my experience implementing ridgeline plots across research contexts, several key principles distinguish effective distributional comparison from inadequate group visualization:
• Statistical Rigor and Comparative Validation: The most effective ridgeline implementations combine distributional visualization with appropriate statistical testing, effect size assessment, and comparative validation that ensures observed distributional differences represent statistically significant and biologically meaningful group distinctions. I consistently recommend employing formal statistical tests for distributional differences, calculating appropriate effect sizes, and conducting post-hoc analyses while using ridgeline plots primarily for pattern recognition and hypothesis generation rather than statistical inference.
• Biological Context and Mechanistic Interpretation: Context-appropriate ridgeline implementation must connect distributional patterns with biological mechanisms, experimental factors, and scientific hypotheses that transform comparative visualization into mechanistic understanding and experimental insight. In my collaborative comparative research, I emphasize interpretation approaches that incorporate biological knowledge, experimental design considerations, and mechanistic frameworks while ensuring that distributional comparisons serve scientific understanding rather than purely descriptive pattern documentation.
• Design Optimization and Visual Communication: Future-oriented ridgeline implementation will increasingly incorporate design optimization principles, accessibility considerations, and visual communication best practices that maximize comparative effectiveness while accommodating diverse audience needs and interpretation contexts. However, the fundamental principles of clear comparative visualization, statistical validation, and biological interpretation will continue to determine the difference between impactful distributional comparison and confusing multi-group displays that cannot support scientific conclusions.
Advancing Your Comparative Visualization Skills
The ridgeline plot examples featured in our curated collection represent effective applications of distributional comparison visualization drawn from publications in Nature, Cell, and other leading scientific journals. Each example demonstrates thoughtful integration of multiple distributions with comparative analysis while advancing understanding of group differences through sophisticated visualization approaches.
My analysis of ridgeline plot implementations across research contexts has reinforced their value for specific comparative visualization needs while emphasizing appropriate application contexts and complementary statistical analysis requirements. When implemented thoughtfully with attention to group organization, statistical validation, and biological interpretation, ridgeline plots can effectively communicate distributional differences that advance comparative understanding and hypothesis development.
I encourage comparative researchers to explore our complete curated collection of ridgeline plot examples, where you can discover additional distributional comparison applications from cutting-edge biological research across multiple comparative contexts. Each plot includes design considerations and interpretation guidance, enabling you to adapt proven comparative visualization approaches to your own research challenges and group analysis objectives.
Want to explore more examples of professional ridgeline plot implementation from top-tier comparative research publications? Check out our curated collection at: Violin Plot - featuring distributional comparison examples from Nature, Cell, and other leading journals, each with complete comparative methodology and statistical validation approaches.
Related Articles

Box Plot Mastery for Clinical Research: Publication-Quality Examples from Leading Medical Studies
Discover how to effectively use box plots in clinical and medical research through real examples from Cell, Nature, and top medical journals. Learn distribution analysis and statistical best practices.
Genomic Data Integration: Circos Plots in Circular Genome Visualization and Multi-Omics Analysis
Master Circos plot creation for genomic data integration and circular visualization through real examples from Nature Genetics, Cell, and leading journals. Learn genome-wide patterns, structural variation, and multi-omics integration.

Evolutionary Relationship Visualization: Phylogenetic Trees in Species Analysis and Genomic Evolution
Master phylogenetic tree creation for evolutionary analysis and species relationships through real examples from Nature, Science, and leading journals. Learn tree topology, branch lengths, and evolutionary inference.