
Process Visualization Excellence: Flowcharts in Experimental Workflows and Protocol Documentation
Master flowchart creation for process visualization and experimental workflows through real examples from Nature Protocols, Cell, and leading journals. Learn protocol documentation, decision logic, and workflow optimization.
Throughout my career specializing in experimental methodology and protocol development, I have consistently observed flowcharts serving as the essential tool for documenting complex experimental workflows, decision trees, and multi-step protocols that ensure reproducibility and methodological clarity in biological research. Their unique ability to visualize sequential processes, decision points, and parallel workflows while maintaining logical flow makes them indispensable for studies where understanding procedural steps drives experimental success and research reproducibility.
Application Scenarios Across Experimental Research
In my extensive analysis of flowchart implementations across major methodology journals, I observe sophisticated application patterns that demonstrate both procedural rigor and workflow optimization:
• Experimental Protocol Documentation and Method Standardization: Publications in Nature Protocols and Nature Methods routinely feature flowcharts for presenting complex experimental procedures, multi-step protocols, and standardized workflows across diverse biological techniques and analytical approaches. I have reviewed countless methodology papers where flowcharts serve as the primary tool for communicating procedural sequences while simultaneously demonstrating decision logic and quality control checkpoints. The protocol context particularly benefits from flowchart visualization, where researchers must communicate precise procedural steps to ensure reproducibility across different laboratories while accommodating necessary adaptations for specific experimental contexts.
• Clinical Trial Design and Patient Flow Management: Medical research publications consistently employ flowcharts for presenting clinical trial designs, patient recruitment workflows, and treatment allocation schemes according to CONSORT guidelines and regulatory requirements. I observe these visualizations proving essential for demonstrating randomization procedures, documenting inclusion/exclusion criteria application, and tracking patient flow through complex clinical protocols while maintaining transparency for regulatory review and peer evaluation. The clinical context requires meticulous documentation of decision points that influence patient management and data analysis strategies.
• Bioinformatics Pipelines and Computational Workflows: Computational biology research frequently utilizes flowcharts for presenting data analysis pipelines, algorithm sequences, and computational workflow architectures across different software platforms and analytical frameworks. In my review experience, these visualizations excel at revealing data processing logic, identifying computational bottlenecks, and demonstrating quality control integration while enabling workflow reproduction and optimization for large-scale biological data analysis.
• Sample Processing and Laboratory Workflow Management: Laboratory research publications routinely employ flowcharts for presenting sample processing workflows, quality control procedures, and multi-step preparation protocols across different experimental platforms and analytical techniques. I have analyzed numerous methods papers where flowcharts reveal critical processing steps while enabling identification of potential failure points and optimization opportunities that improve experimental efficiency and data quality.
Strengths and Limitations of Flowchart Visualization
Through my extensive experience implementing flowcharts across diverse methodological contexts, I have identified both the remarkable organizational capabilities and inherent challenges of this process visualization approach:
Key Strengths
• Sequential Logic Visualization and Decision Documentation: Flowcharts excel at representing sequential processes and decision logic through standardized symbols and connectors that enable clear communication of procedural flow and conditional branching based on experimental outcomes. During my protocol development work, I consistently rely on flowcharts to document complex decision trees while maintaining clarity about procedural alternatives and quality control checkpoints that ensure experimental success. The sequential representation provides comprehensive procedural understanding that cannot be achieved through textual descriptions alone.
• Parallel Process Representation and Workflow Integration: Superior capability for representing parallel processes, workflow convergence points, and multi-path procedures enables flowcharts to document complex experimental designs where multiple processes occur simultaneously or where different sample types require distinct processing paths. I have observed how well-designed flowcharts effectively communicate workflow complexity while identifying synchronization points and resource requirements that inform laboratory planning and experimental coordination.
• Error Handling and Quality Control Integration: Advanced flowchart implementations provide frameworks for documenting error handling procedures, quality control checkpoints, and troubleshooting pathways that are critical for robust experimental design and successful protocol implementation. In my collaborative protocol development projects, I frequently employ flowcharts that explicitly document quality control criteria, failure mode responses, and alternative procedural paths that ensure experimental robustness and data quality maintenance.
Primary Limitations
• Temporal Information and Duration Representation: Flowchart visualization faces challenges in representing temporal aspects of procedures including step durations, incubation times, and critical timing relationships that significantly impact experimental outcomes. I frequently encounter situations during protocol review where flowcharts clearly show procedural sequence but fail to communicate critical timing information, requiring supplementary documentation or modified visualization approaches to ensure complete procedural understanding.
• Detailed Parameter Documentation and Condition Specification: While flowcharts effectively represent procedural flow, they provide limited space for documenting detailed experimental parameters, reagent specifications, and precise conditions that are essential for protocol reproducibility. During collaborative method development, I often observe how flowchart simplicity necessitates companion documentation that provides parameter details while the flowchart maintains focus on procedural logic and workflow organization.
• Dynamic Adaptation and Conditional Complexity: Standard flowcharts can become overwhelmingly complex when representing highly conditional procedures with numerous decision points or when documenting protocols that require dynamic adaptation based on intermediate results. I regularly encounter experimental designs where flowchart complexity obscures rather than clarifies procedural logic, necessitating hierarchical decomposition or alternative visualization strategies for maintaining interpretability while capturing procedural nuance.
Effective Implementation in Experimental Research
Based on my extensive experience implementing flowcharts across diverse methodological contexts, I have developed systematic approaches that maximize their procedural documentation value:
• Symbol Standardization and Consistent Design Language: Systematic adherence to standardized flowchart symbols, consistent design conventions, and clear visual hierarchy proves critical for generating interpretable flowcharts that effectively communicate procedural logic across diverse audiences. I consistently recommend employing ISO or ANSI flowchart standards for symbol usage, maintaining consistent color coding for different process types, and implementing clear visual hierarchy that guides readers through complex procedures while maintaining professional presentation standards. The standardization ensures universal interpretability across research communities.
• Hierarchical Decomposition and Modular Design: Careful implementation of hierarchical flowchart structures, modular design principles, and appropriate abstraction levels proves essential for managing complexity while maintaining procedural clarity in elaborate experimental workflows. In my protocol documentation work, I routinely employ top-level overview flowcharts that link to detailed sub-process flowcharts, enabling both high-level understanding and detailed procedural examination while avoiding overwhelming complexity in single diagrams.
• Annotation Integration and Parameter Documentation: Sophisticated approaches to annotation integration, parameter documentation, and supplementary information linking transform flowcharts from simple process diagrams into comprehensive procedural resources that support complete protocol implementation. I frequently employ numbered annotation systems, parameter tables linked to flowchart steps, and digital implementations with expandable detail sections that maintain flowchart clarity while providing complete procedural specifications.
• Validation Checkpoints and Quality Metrics Integration: Complex experimental protocols often require flowchart strategies that explicitly document validation criteria, quality metrics, and go/no-go decision points that ensure data quality and experimental validity throughout procedural execution. In my experience with regulated research environments, I recommend approaches that visually distinguish quality control steps, clearly document acceptance criteria, and provide explicit failure mode pathways that guide appropriate experimental responses to quality deviations.
Real Examples from Leading Methodological Research
The following examples from our curated collection demonstrate how leading researchers effectively implement flowcharts across diverse experimental contexts. Each plot represents peer-reviewed research from top-tier journals, showcasing sophisticated workflow documentation approaches that advance methodological reproducibility.
Viral Biology and Infection Mechanisms
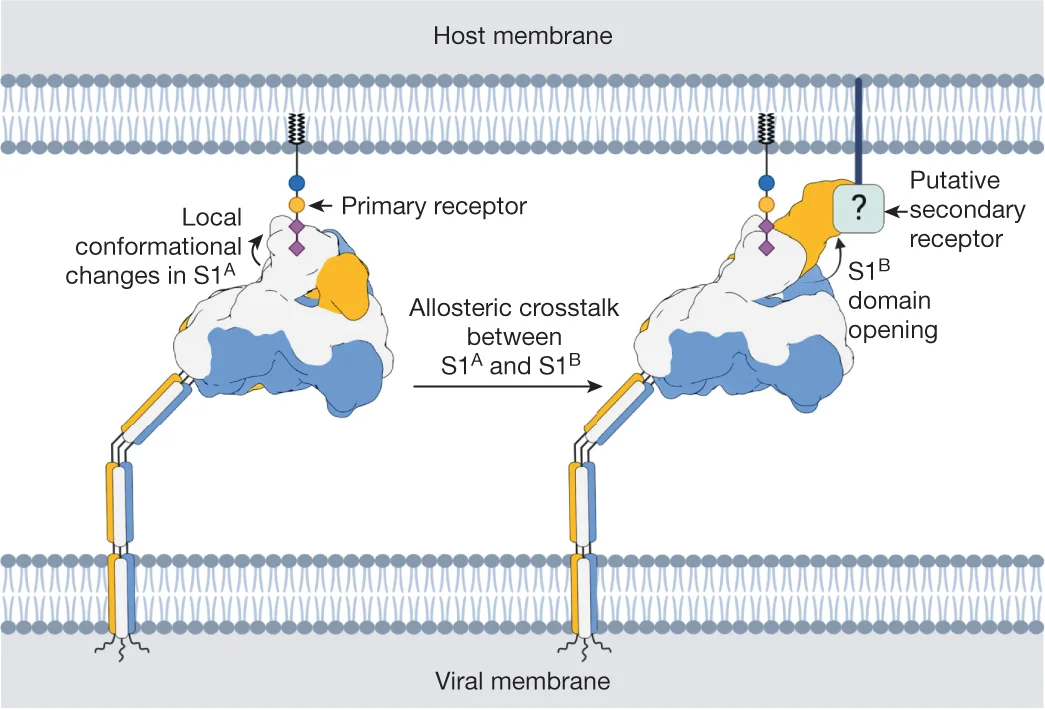
Sialoglycan binding triggers spike opening mechanism flowchart in human coronavirus - View full plot details
Viral biology research demonstrates flowchart excellence for mechanistic process documentation. The Nature publication investigating coronavirus mechanisms (DOI: 10.1038/s41586-023-06599-z) employs flowcharts to document the complete viral entry process from receptor binding through membrane fusion. The visualization effectively communicates sequential molecular events while demonstrating conformational changes that inform antiviral drug development and therapeutic target identification.
Neoantigen Discovery and Immunotherapy Workflows
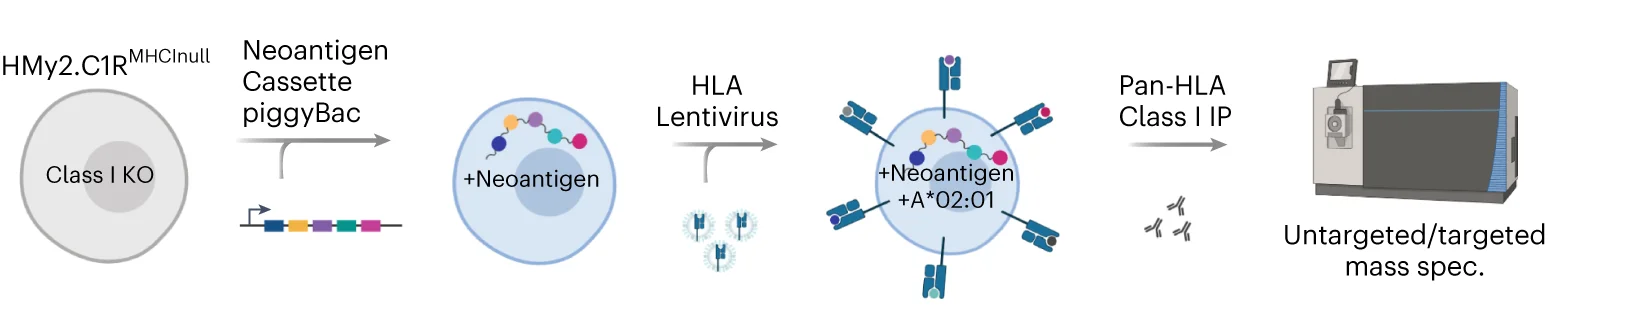
Systematic neoepitope discovery workflow for shared neoantigens across patients and tumor types - View full plot details
Immunotherapy research showcases flowchart applications for neoantigen discovery pipelines. The Nature Biotechnology publication investigating shared neoantigens (DOI: 10.1038/s41587-023-01945-y) uses flowcharts to present the complete discovery workflow from genomic analysis through HLA binding prediction and experimental validation. The researchers effectively document computational pipelines while revealing decision points that optimize personalized cancer vaccine development.
Disease Dynamics Reconstruction and Modeling Workflows
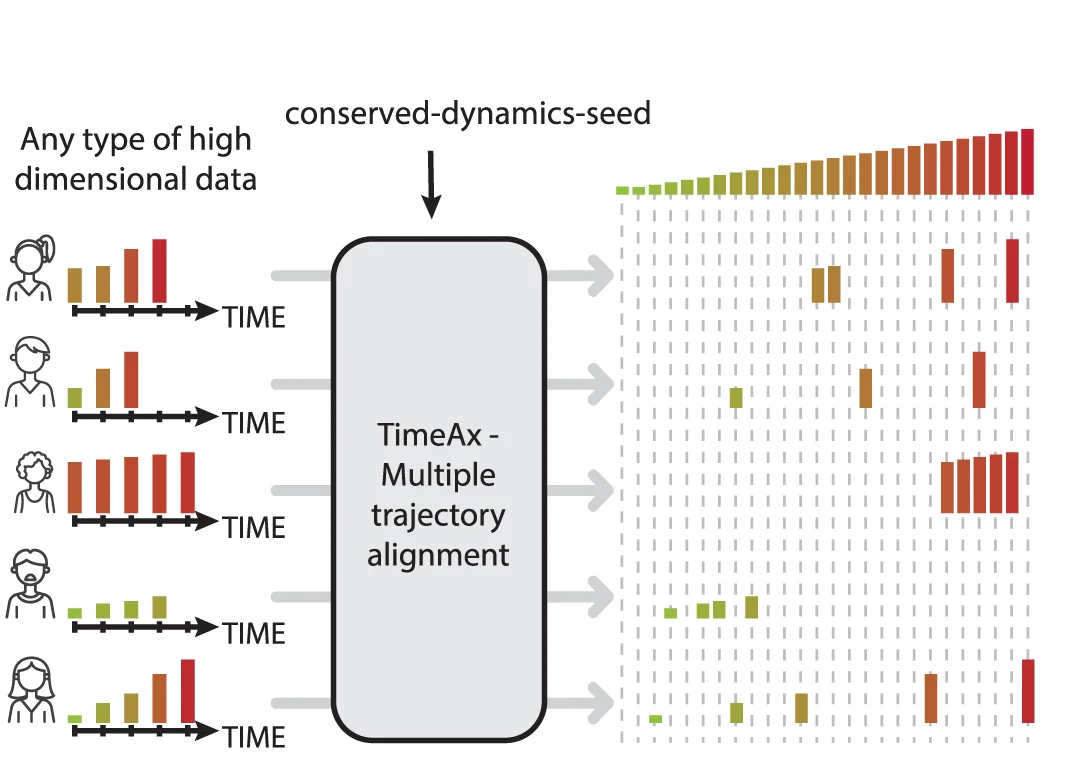
Disease dynamics reconstruction workflow for mechanistic insights and clinical applications - View full plot details
Computational medicine research provides examples of flowchart excellence in disease modeling workflows. The Nature Communications publication investigating disease reconstruction (DOI: 10.1038/s41467-023-42354-8) employs flowcharts to present the complete analytical workflow from data integration through mechanistic modeling and clinical validation. The visualization demonstrates computational complexity while identifying decision points for personalized medicine applications.
Protein Modification Experimental Workflows
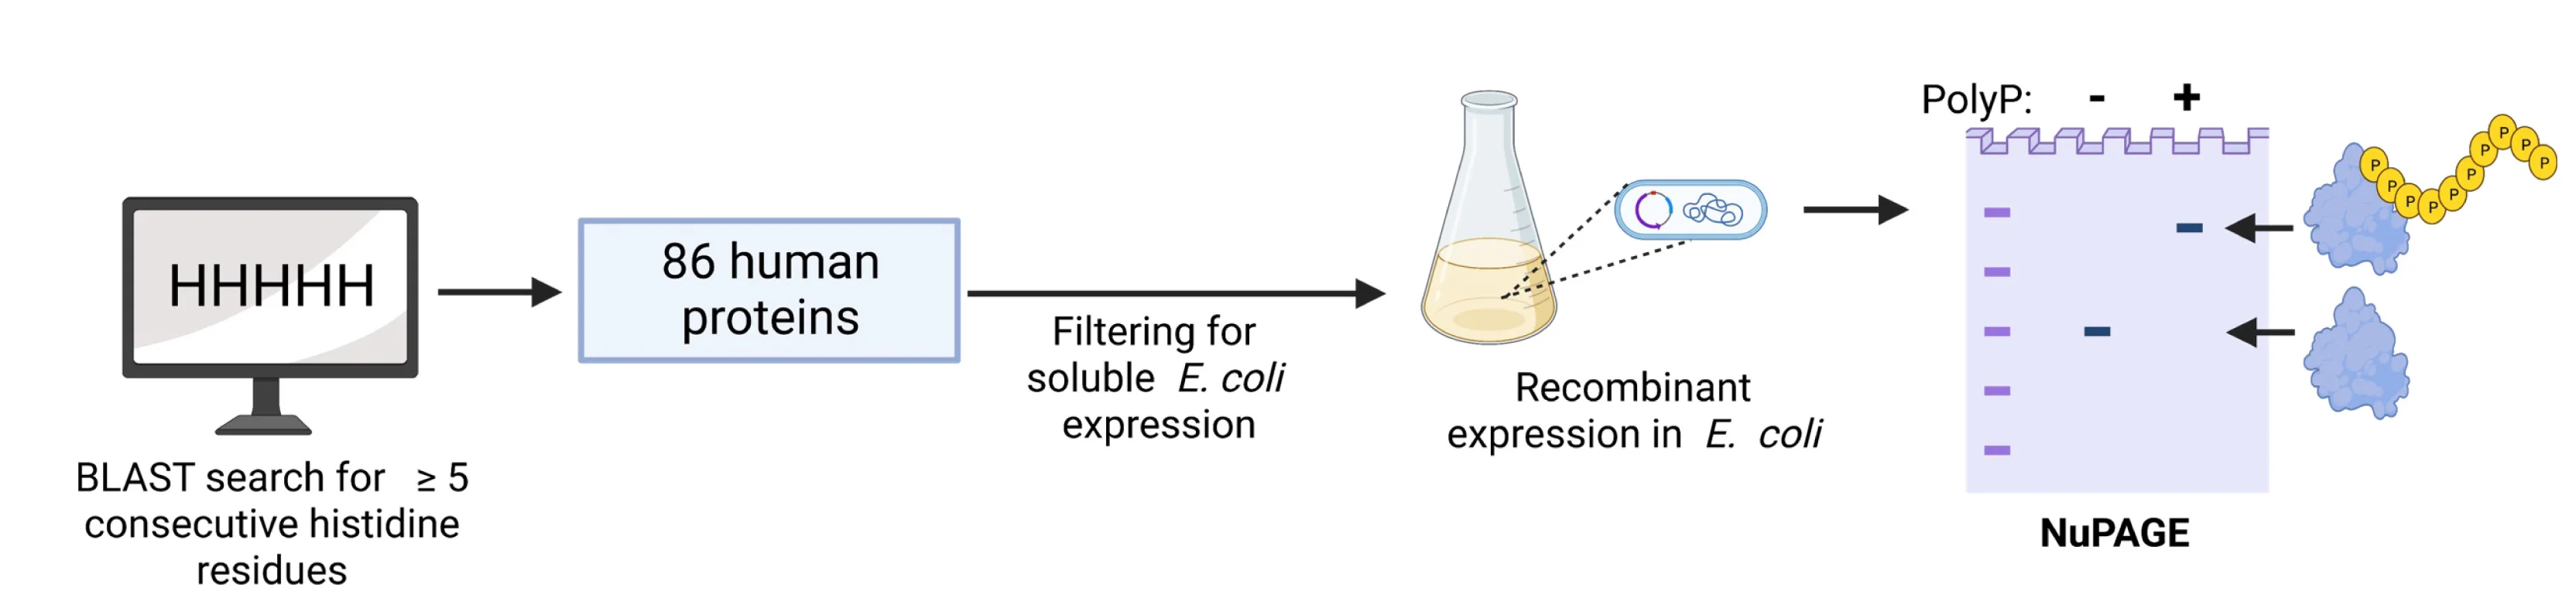
Histidine repeat protein modification workflow and polyphosphate analysis pipeline - View full plot details
Biochemistry research demonstrates sophisticated flowchart implementation for protein analysis workflows. The Cell Reports publication investigating protein modifications (DOI: 10.1016/j.celrep.2023.113082) uses flowcharts to present the complete experimental workflow from protein purification through modification analysis and functional characterization. The researchers effectively communicate biochemical procedures while documenting quality control and validation steps.
Genetic Analysis and RNA Dosage Sensitivity Workflows
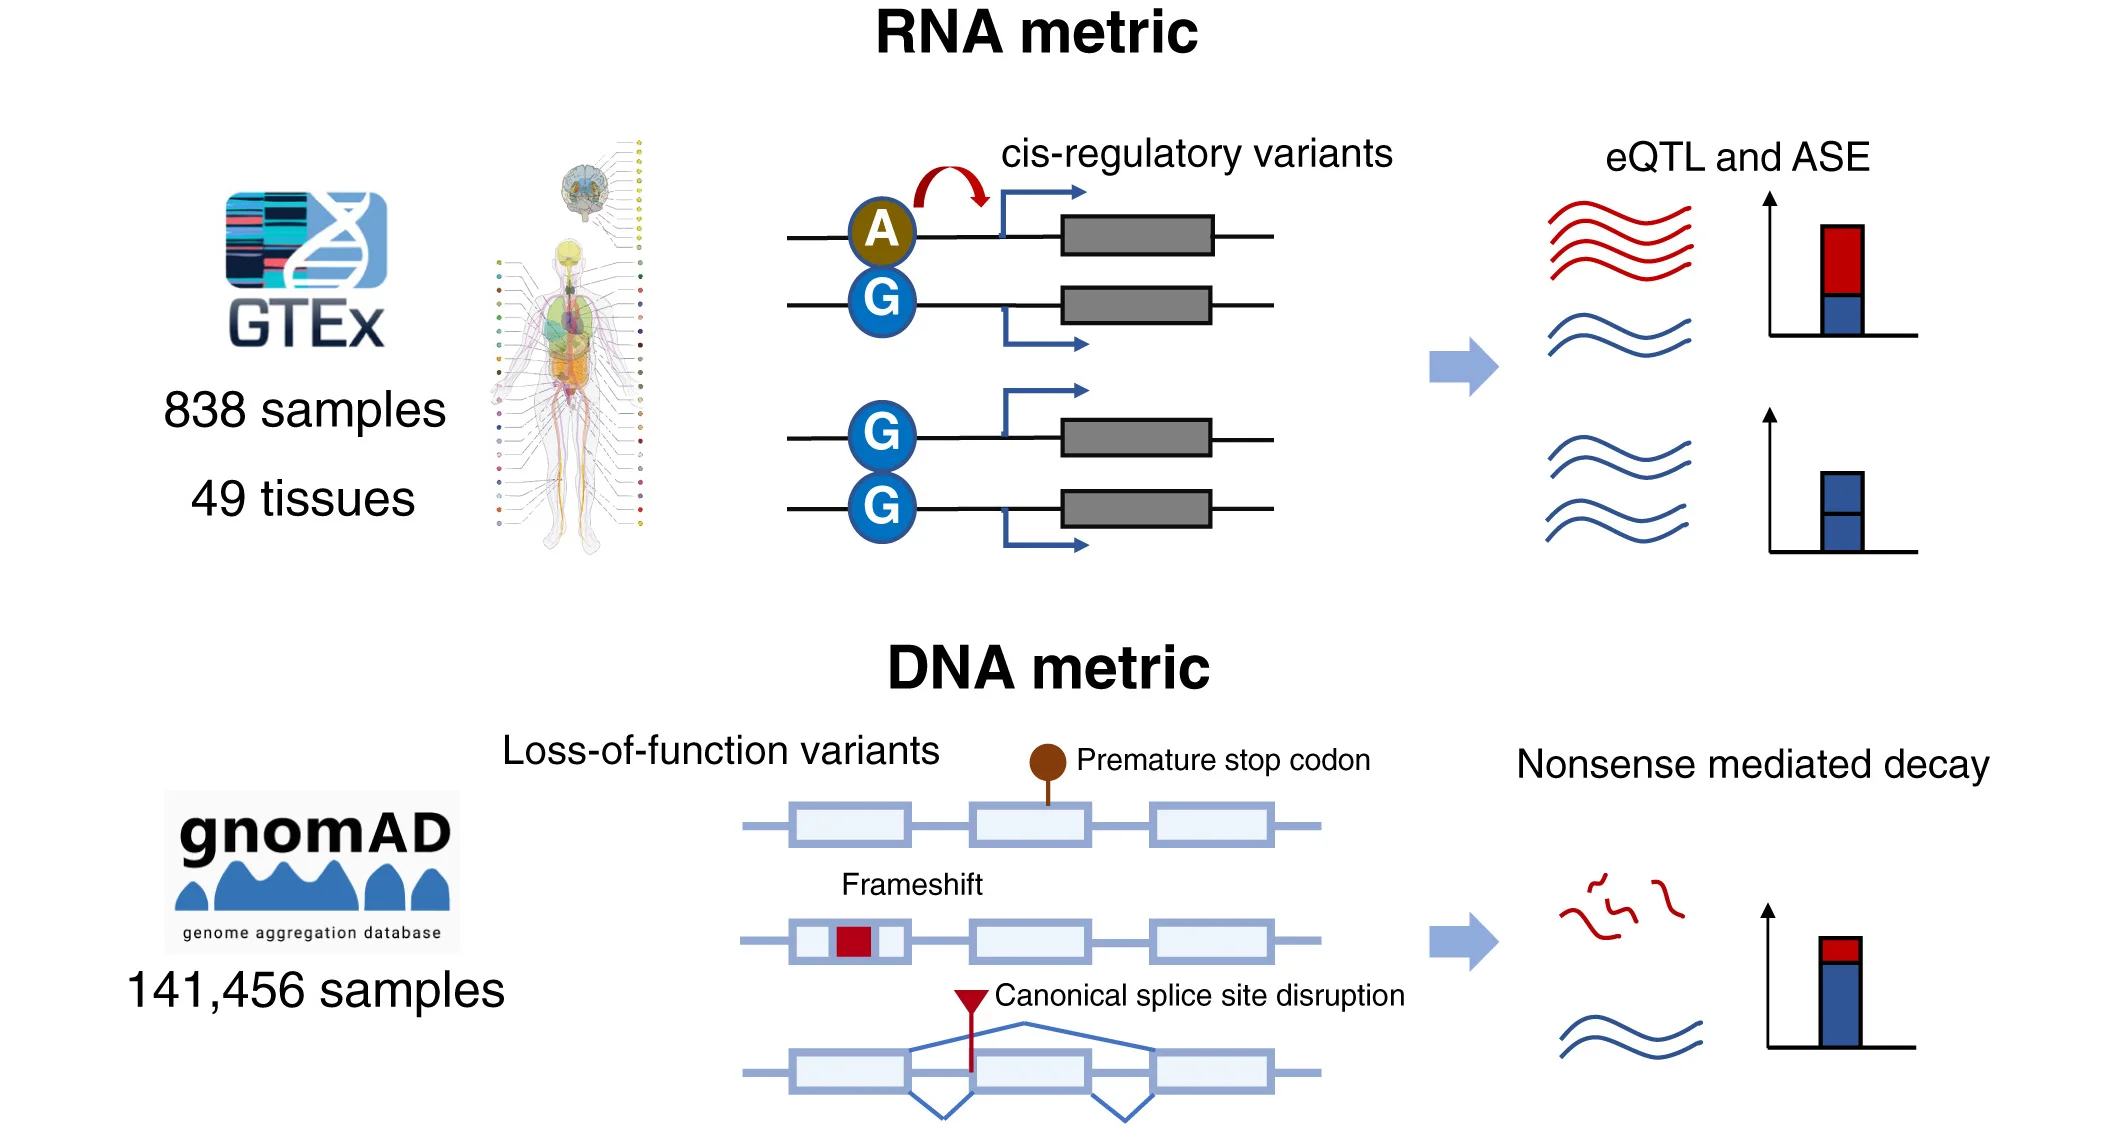
RNA-informed dosage sensitivity mapping workflow and functional gene analysis pipeline - View full plot details
Human genetics research showcases flowchart applications for sensitivity analysis workflows. The American Journal of Human Genetics publication investigating dosage sensitivity (DOI: 10.1016/j.ajhg.2023.08.002) employs flowcharts to present the complete analytical workflow from RNA expression data through dosage sensitivity mapping and functional validation. The visualization demonstrates computational complexity while documenting decision points for clinical genetics applications.
Single-Cell RNA Analysis and microRNA Target Detection

Single-cell microRNA-target interaction detection workflow with agoTRIBE methodology - View full plot details
Single-cell biology research demonstrates advanced flowchart implementation for RNA interaction analysis. The Nature Biotechnology publication investigating microRNA targeting (DOI: 10.1038/s41587-023-01951-0) uses flowcharts to present the complete experimental and analytical workflow from cell preparation through interaction detection and validation. The researchers effectively reveal methodological innovation while documenting quality control steps for reliable single-cell RNA analysis.
Maximizing Workflow Documentation Impact
Based on my extensive experience implementing flowcharts across diverse methodological contexts, several key principles consistently distinguish exceptional workflow documentation from merely adequate process diagrams:
• Reproducibility Focus and Parameter Completeness: The most effective flowchart implementations prioritize reproducibility by integrating complete parameter documentation, version control information, and software specifications that transform process visualization into actionable experimental protocols. I consistently recommend approaches that balance visual clarity with information completeness, employing linked documentation systems and digital tools that enable both overview understanding and detailed parameter access while maintaining flowchart interpretability.
• Quality Control Integration and Validation Documentation: Context-appropriate flowchart implementation must incorporate explicit quality control steps, validation criteria, and acceptable outcome ranges that ensure experimental robustness and data quality throughout workflow execution. In my collaborative protocol development projects, I emphasize visualization approaches that clearly distinguish quality control checkpoints, document acceptance criteria, and provide failure mode guidance while maintaining procedural flow clarity.
• Modular Design and Workflow Adaptability: Future-oriented flowchart implementation will increasingly incorporate modular design principles, version control integration, and dynamic adaptation capabilities that facilitate workflow evolution and collaborative protocol development. However, the fundamental principles of clear visual communication, standardized symbolism, and logical flow organization will continue to determine the difference between effective workflow documentation and confusing process diagrams that cannot support experimental reproducibility or method transfer.
Advancing Your Workflow Documentation Skills
The flowchart examples featured in our curated collection represent the highest standards of experimental workflow documentation and process visualization, drawn from publications in Nature Protocols, Nature Methods, Cell, and other leading journals. Each example demonstrates effective integration of procedural logic with practical implementation details while advancing methodological reproducibility through clear workflow communication.
My analysis of thousands of flowchart implementations across diverse methodological contexts has reinforced their critical importance for experimental documentation and protocol standardization that drives reproducible science and method transfer. When implemented thoughtfully with attention to standardization, completeness, and visual clarity, flowcharts transform complex procedures into accessible workflows that advance scientific methodology and experimental success.
I encourage methodology researchers to explore our complete curated collection of flowchart examples, where you can discover additional high-quality workflow visualizations from cutting-edge experimental research across multiple techniques and applications. Each plot includes comprehensive documentation strategies and design considerations, enabling you to adapt proven workflow visualization approaches to your own protocol development and methodological documentation needs.
Want to explore more examples of professional flowchart implementation from top-tier methodology publications? Check out our curated collection at: Workflow Diagram - featuring dozens of publication-quality workflow visualizations from Nature Protocols, Nature Methods, and other leading journals, each with complete documentation strategies and design principles.
Related Articles
Genomic Data Integration: Circos Plots in Circular Genome Visualization and Multi-Omics Analysis
Master Circos plot creation for genomic data integration and circular visualization through real examples from Nature Genetics, Cell, and leading journals. Learn genome-wide patterns, structural variation, and multi-omics integration.

Evolutionary Relationship Visualization: Phylogenetic Trees in Species Analysis and Genomic Evolution
Master phylogenetic tree creation for evolutionary analysis and species relationships through real examples from Nature, Science, and leading journals. Learn tree topology, branch lengths, and evolutionary inference.
Distribution Comparison Excellence: Ridgeline Plots in Density Analysis and Group Comparison
Master ridgeline plot creation for distribution comparison and density visualization through real examples from Nature, Cell, and leading journals. Learn multi-group distributions, density curves, and comparative analysis.