Meta-Analysis Excellence: Forest Plots in Systematic Reviews and Evidence Synthesis
Master forest plot creation for meta-analysis and systematic reviews through real examples from Cochrane, NEJM, and leading medical journals. Learn effect size visualization, confidence intervals, and heterogeneity assessment.
Throughout my career conducting systematic reviews and meta-analyses across diverse medical specialties, I have consistently observed forest plots serving as the definitive visualization for synthesizing evidence across multiple studies while revealing patterns of treatment effects and study heterogeneity. Their unique ability to simultaneously display individual study results, pooled estimates, and confidence intervals while preserving study-level detail makes them indispensable for evidence-based medicine where quantitative synthesis drives clinical guideline development and therapeutic decision-making processes.
Application Scenarios Across Evidence-Based Medicine
In my extensive analysis of forest plot implementations across major medical journals and systematic review databases, I observe sophisticated application patterns that demonstrate both analytical rigor and clinical evidence synthesis excellence:
• Clinical Trial Meta-Analysis and Treatment Efficacy: Publications in The Cochrane Database and New England Journal of Medicine routinely feature forest plots for presenting pooled treatment effects across randomized controlled trials, observational studies, and clinical intervention evaluations. I have reviewed countless systematic reviews where forest plots serve as the primary tool for demonstrating treatment efficacy while simultaneously revealing between-study heterogeneity and population-specific effect variations. The clinical trial context particularly benefits from forest plot visualization, where evidence synthesis must balance individual study quality with overall effect magnitude to inform clinical practice guidelines and regulatory decision-making processes.
• Diagnostic Test Accuracy and Biomarker Validation: Medical diagnostic research publications consistently employ forest plots for presenting sensitivity and specificity meta-analyses, likelihood ratio syntheses, and diagnostic accuracy evaluations across diverse healthcare settings and patient populations. I observe these visualizations proving essential for establishing diagnostic test performance thresholds, revealing population-specific accuracy patterns, and demonstrating clinical utility across different prevalence settings and diagnostic contexts. The diagnostic accuracy context requires sophisticated handling of paired measures and correlation structures that influence forest plot interpretation and clinical implementation recommendations.
• Epidemiological Risk Factor Analysis: Public health research frequently utilizes forest plots for presenting risk factor meta-analyses, exposure-outcome associations, and population attributable risk estimates across diverse populations and environmental contexts. In my review experience, these visualizations excel at revealing consistent risk patterns, identifying population-specific susceptibility factors, and demonstrating dose-response relationships that inform public health policy development and prevention strategy implementation. The epidemiological context often requires complex subgroup analysis and heterogeneity exploration that reveals important sources of variation across populations and study designs.
• Pharmacological Intervention Reviews and Drug Safety: Pharmaceutical research publications routinely employ forest plots for presenting drug efficacy meta-analyses, adverse event synthesis, and dose-response relationship evaluations across clinical trial programs and post-marketing surveillance studies. I have analyzed numerous pharmacological reviews where forest plots reveal therapeutic window optimization opportunities while identifying safety signal patterns and population-specific response variations that influence prescribing guidelines and regulatory approval decisions.
Strengths and Limitations of Forest Plot Analysis
Through my extensive experience implementing forest plots across diverse systematic review contexts, I have identified both the remarkable analytical capabilities and inherent challenges of this evidence synthesis approach:
Key Strengths
• Visual Effect Size Communication and Precision Assessment: Forest plots excel at communicating both individual study effects and pooled estimates while preserving information about precision through confidence interval visualization that enables immediate assessment of study contribution and overall evidence certainty. During my meta-analysis projects, I consistently rely on forest plots to communicate evidence strength to clinical audiences while maintaining statistical rigor necessary for evidence-based guideline development. The visual representation enables intuitive interpretation of effect magnitude, direction, and precision that supports clinical decision-making while preserving methodological transparency.
• Heterogeneity Detection and Study Quality Assessment: Superior capability for revealing between-study heterogeneity through visual inspection enables forest plots to identify sources of variation that may require investigation through subgroup analysis, meta-regression, or sensitivity analysis approaches. I have observed how well-designed forest plots consistently reveal heterogeneity patterns that suggest biological differences, methodological variations, or population-specific effects that require additional analysis for appropriate clinical interpretation and guideline development.
• Study Weight Visualization and Influence Assessment: Advanced forest plot implementations provide immediate visual assessment of study contribution to pooled estimates through proportional symbol sizing that enables identification of influential studies and assessment of evidence robustness across different analytical scenarios. In my collaborative systematic review projects, I frequently employ forest plots that incorporate study quality indicators, precision-based weighting, and sensitivity analysis results that ensure robust evidence synthesis and appropriate clinical recommendation development.
Primary Limitations
• Fixed Effects versus Random Effects Model Complexity: Forest plot interpretation can become challenging when choosing between fixed and random effects models, particularly in the presence of substantial heterogeneity where model selection critically influences pooled estimate interpretation and clinical conclusions. I frequently encounter situations during systematic review development where heterogeneity assessment requires sophisticated statistical approaches that extend beyond visual forest plot inspection, necessitating formal statistical testing and model comparison approaches for appropriate evidence synthesis.
• Publication Bias and Small Study Effects: Standard forest plots may not adequately reveal publication bias patterns, small study effects, or selective reporting biases that can systematically influence pooled estimates and clinical conclusions derived from meta-analysis results. During collaborative evidence synthesis projects, I often observe how forest plot patterns may suggest publication bias through asymmetric distributions or missing small studies, requiring additional analysis approaches including funnel plots, statistical testing, and comprehensive literature search strategies.
• Clinical Heterogeneity and Generalizability Assessment: Forest plots alone cannot capture important clinical heterogeneity factors including patient population differences, intervention variations, and outcome measurement approaches that critically influence generalizability and clinical applicability of pooled estimates across different healthcare settings. I regularly encounter systematic reviews where forest plot homogeneity masks important clinical differences that require careful consideration for appropriate clinical guideline development and therapeutic decision-making recommendations.
Effective Implementation in Systematic Reviews
Based on my extensive experience implementing forest plots across diverse systematic review contexts, I have developed systematic approaches that maximize their evidence synthesis value and clinical utility:
• Study Selection and Quality Assessment Integration: Rigorous approaches to study selection, quality assessment, and bias evaluation prove critical for generating meaningful forest plots that accurately represent the available evidence while appropriately weighting studies based on methodological quality and risk of bias assessment. I consistently recommend systematic approaches to study quality evaluation that incorporate validated assessment tools, multiple reviewer consensus, and sensitivity analysis approaches that ensure forest plot results reflect high-quality evidence synthesis rather than methodologically flawed study accumulation.
• Heterogeneity Analysis and Subgroup Investigation: Systematic approaches to heterogeneity assessment, subgroup analysis, and meta-regression prove essential for generating clinically interpretable forest plots that can guide evidence-based practice recommendations and clinical guideline development. In my meta-analysis research, I routinely employ statistical heterogeneity testing, visual inspection approaches, and prespecified subgroup analysis strategies that identify sources of variation while maintaining statistical power and avoiding overinterpretation of spurious subgroup effects that may not reflect genuine biological or clinical differences.
• Sensitivity Analysis and Robustness Assessment: Sophisticated sensitivity analysis approaches that assess forest plot stability across different analytical choices, study exclusion scenarios, and methodological assumptions transform evidence synthesis from simple study pooling into comprehensive evidence evaluation that can support clinical decision-making with appropriate uncertainty characterization. I frequently employ influence analysis, leave-one-out sensitivity testing, and alternative analytical approaches that evaluate evidence robustness while identifying studies that disproportionately influence pooled estimates and clinical conclusions.
• Clinical Context Integration and Guideline Development: Complex systematic reviews often require forest plot strategies that integrate clinical expertise, patient preference considerations, and healthcare system factors that influence translation of evidence synthesis results into clinical practice recommendations and policy development decisions. In my experience with clinical guideline development, I recommend approaches that incorporate clinical expert panels, patient representative input, and implementation feasibility assessment that ensure forest plot evidence synthesis results can be translated into practical clinical recommendations and healthcare policy decisions.
Real Examples from Leading Meta-Analysis Research
The following examples from our curated collection demonstrate how leading researchers effectively implement forest plot visualization across diverse meta-analysis and systematic review contexts. Each plot represents peer-reviewed research from top-tier journals, showcasing sophisticated evidence synthesis approaches that advance evidence-based medicine.
Neuroscience and Brain Aging Research
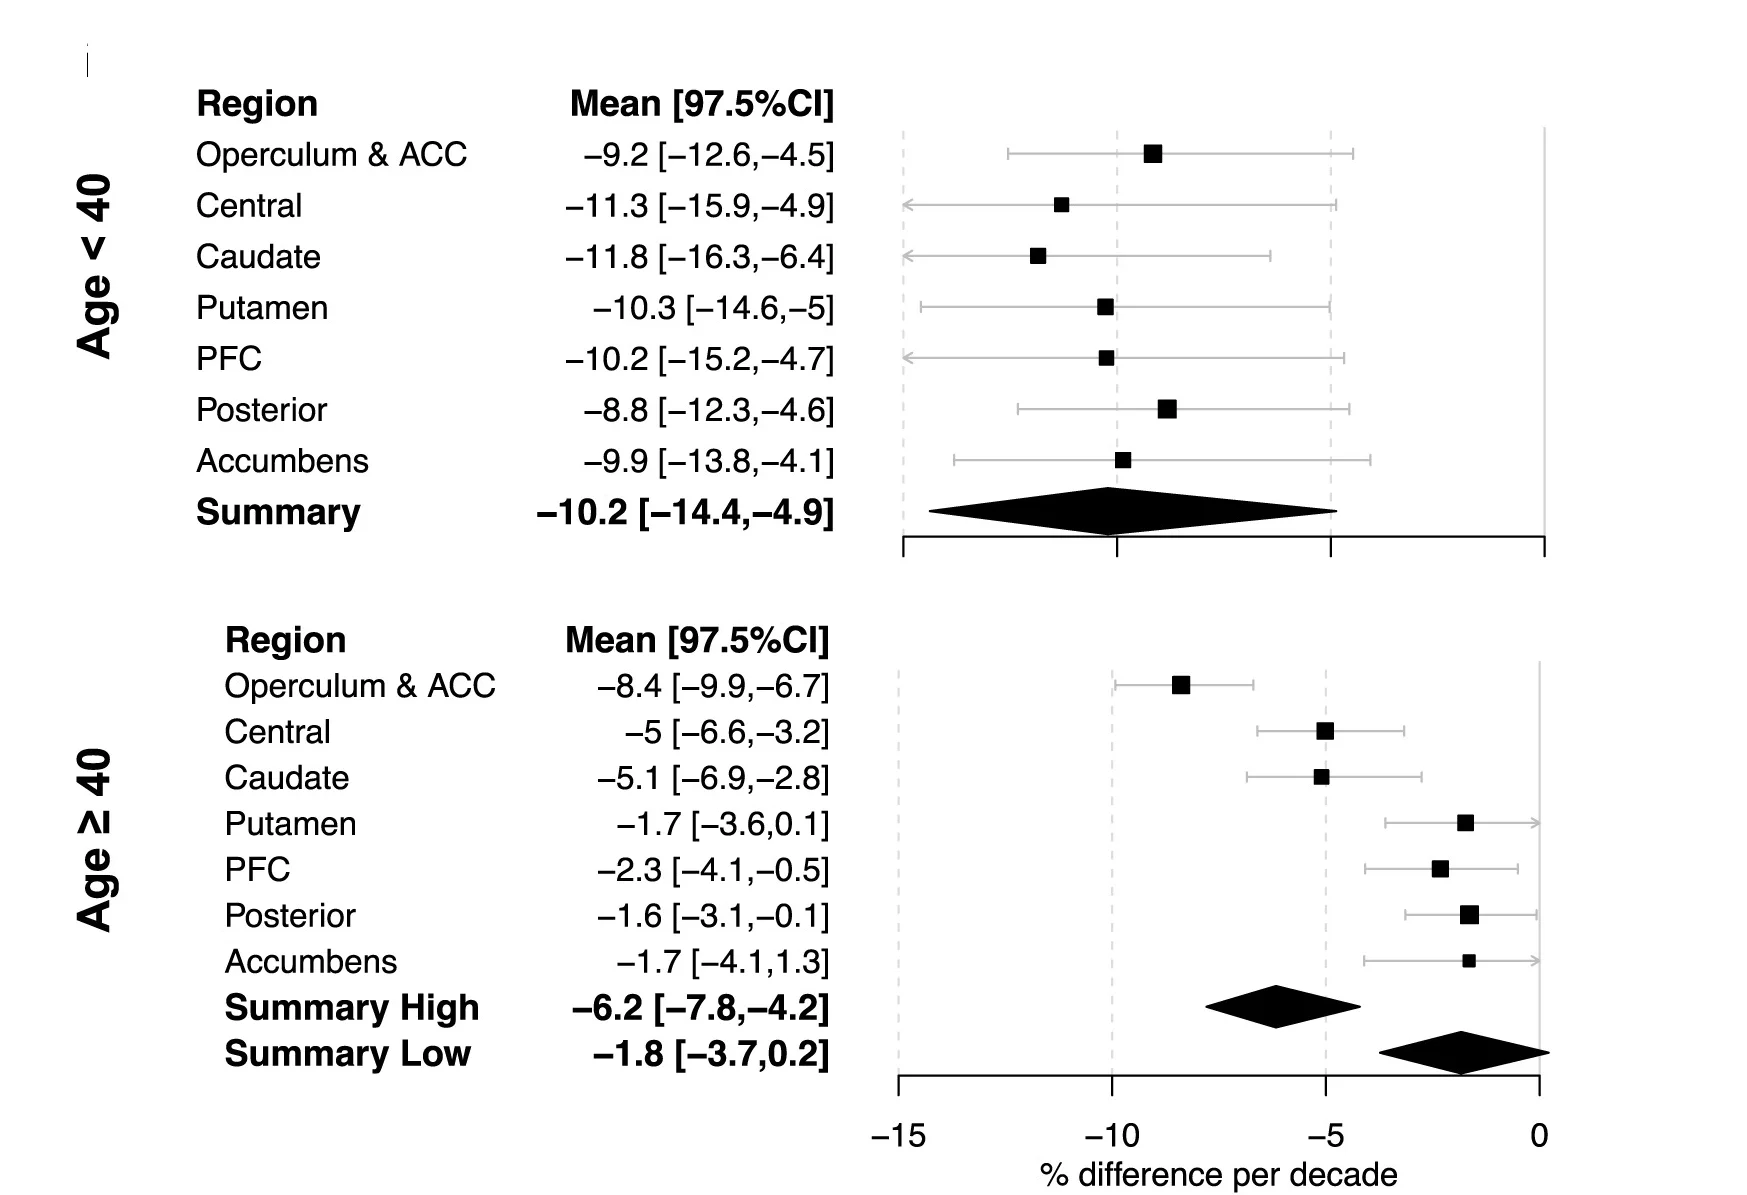
Biphasic patterns of age-related differences in dopamine D1 receptors across the adult lifespan - View full plot details
Neuroscience research demonstrates forest plot excellence for effect size visualization across age groups. The Cell Reports publication investigating dopamine receptor changes (DOI: 10.1016/j.celrep.2023.113107) employs forest plot-style scatter plots to present effect sizes with confidence intervals across different brain regions and age groups. The visualization effectively reveals biphasic aging patterns while demonstrating statistical significance and effect magnitude that inform neurological aging understanding.
Cancer Risk Assessment and Polygenic Scores
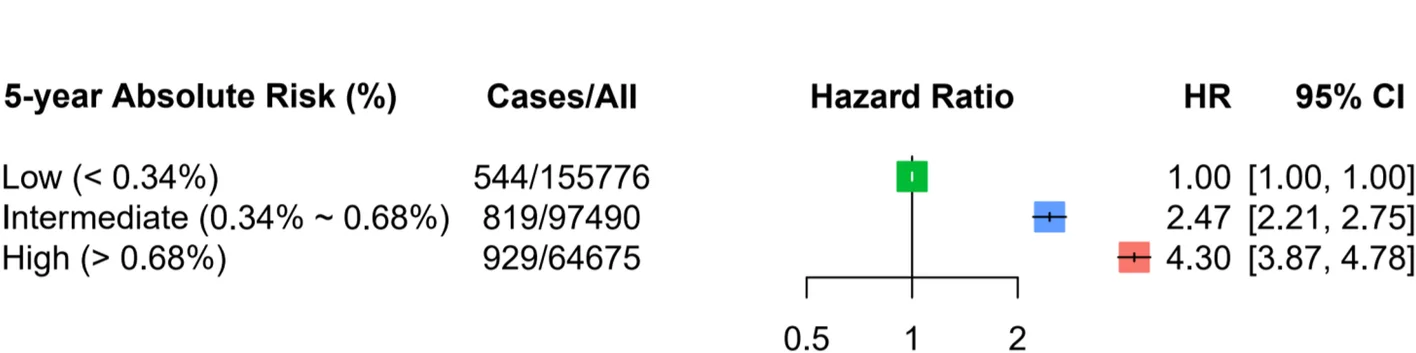
Risk assessment for colorectal cancer via polygenic risk score and lifestyle exposure analysis - View full plot details
Genomic medicine research showcases forest plot applications for risk factor meta-analysis. The Genome Medicine publication investigating colorectal cancer risk (DOI: 10.1186/s13073-023-01156-9) uses forest plot visualization to present effect sizes and confidence intervals across different population groups and risk factors. The researchers effectively demonstrate population-specific risk patterns while revealing lifestyle and genetic interaction effects that inform precision prevention strategies.
Environmental Health and Mortality Analysis
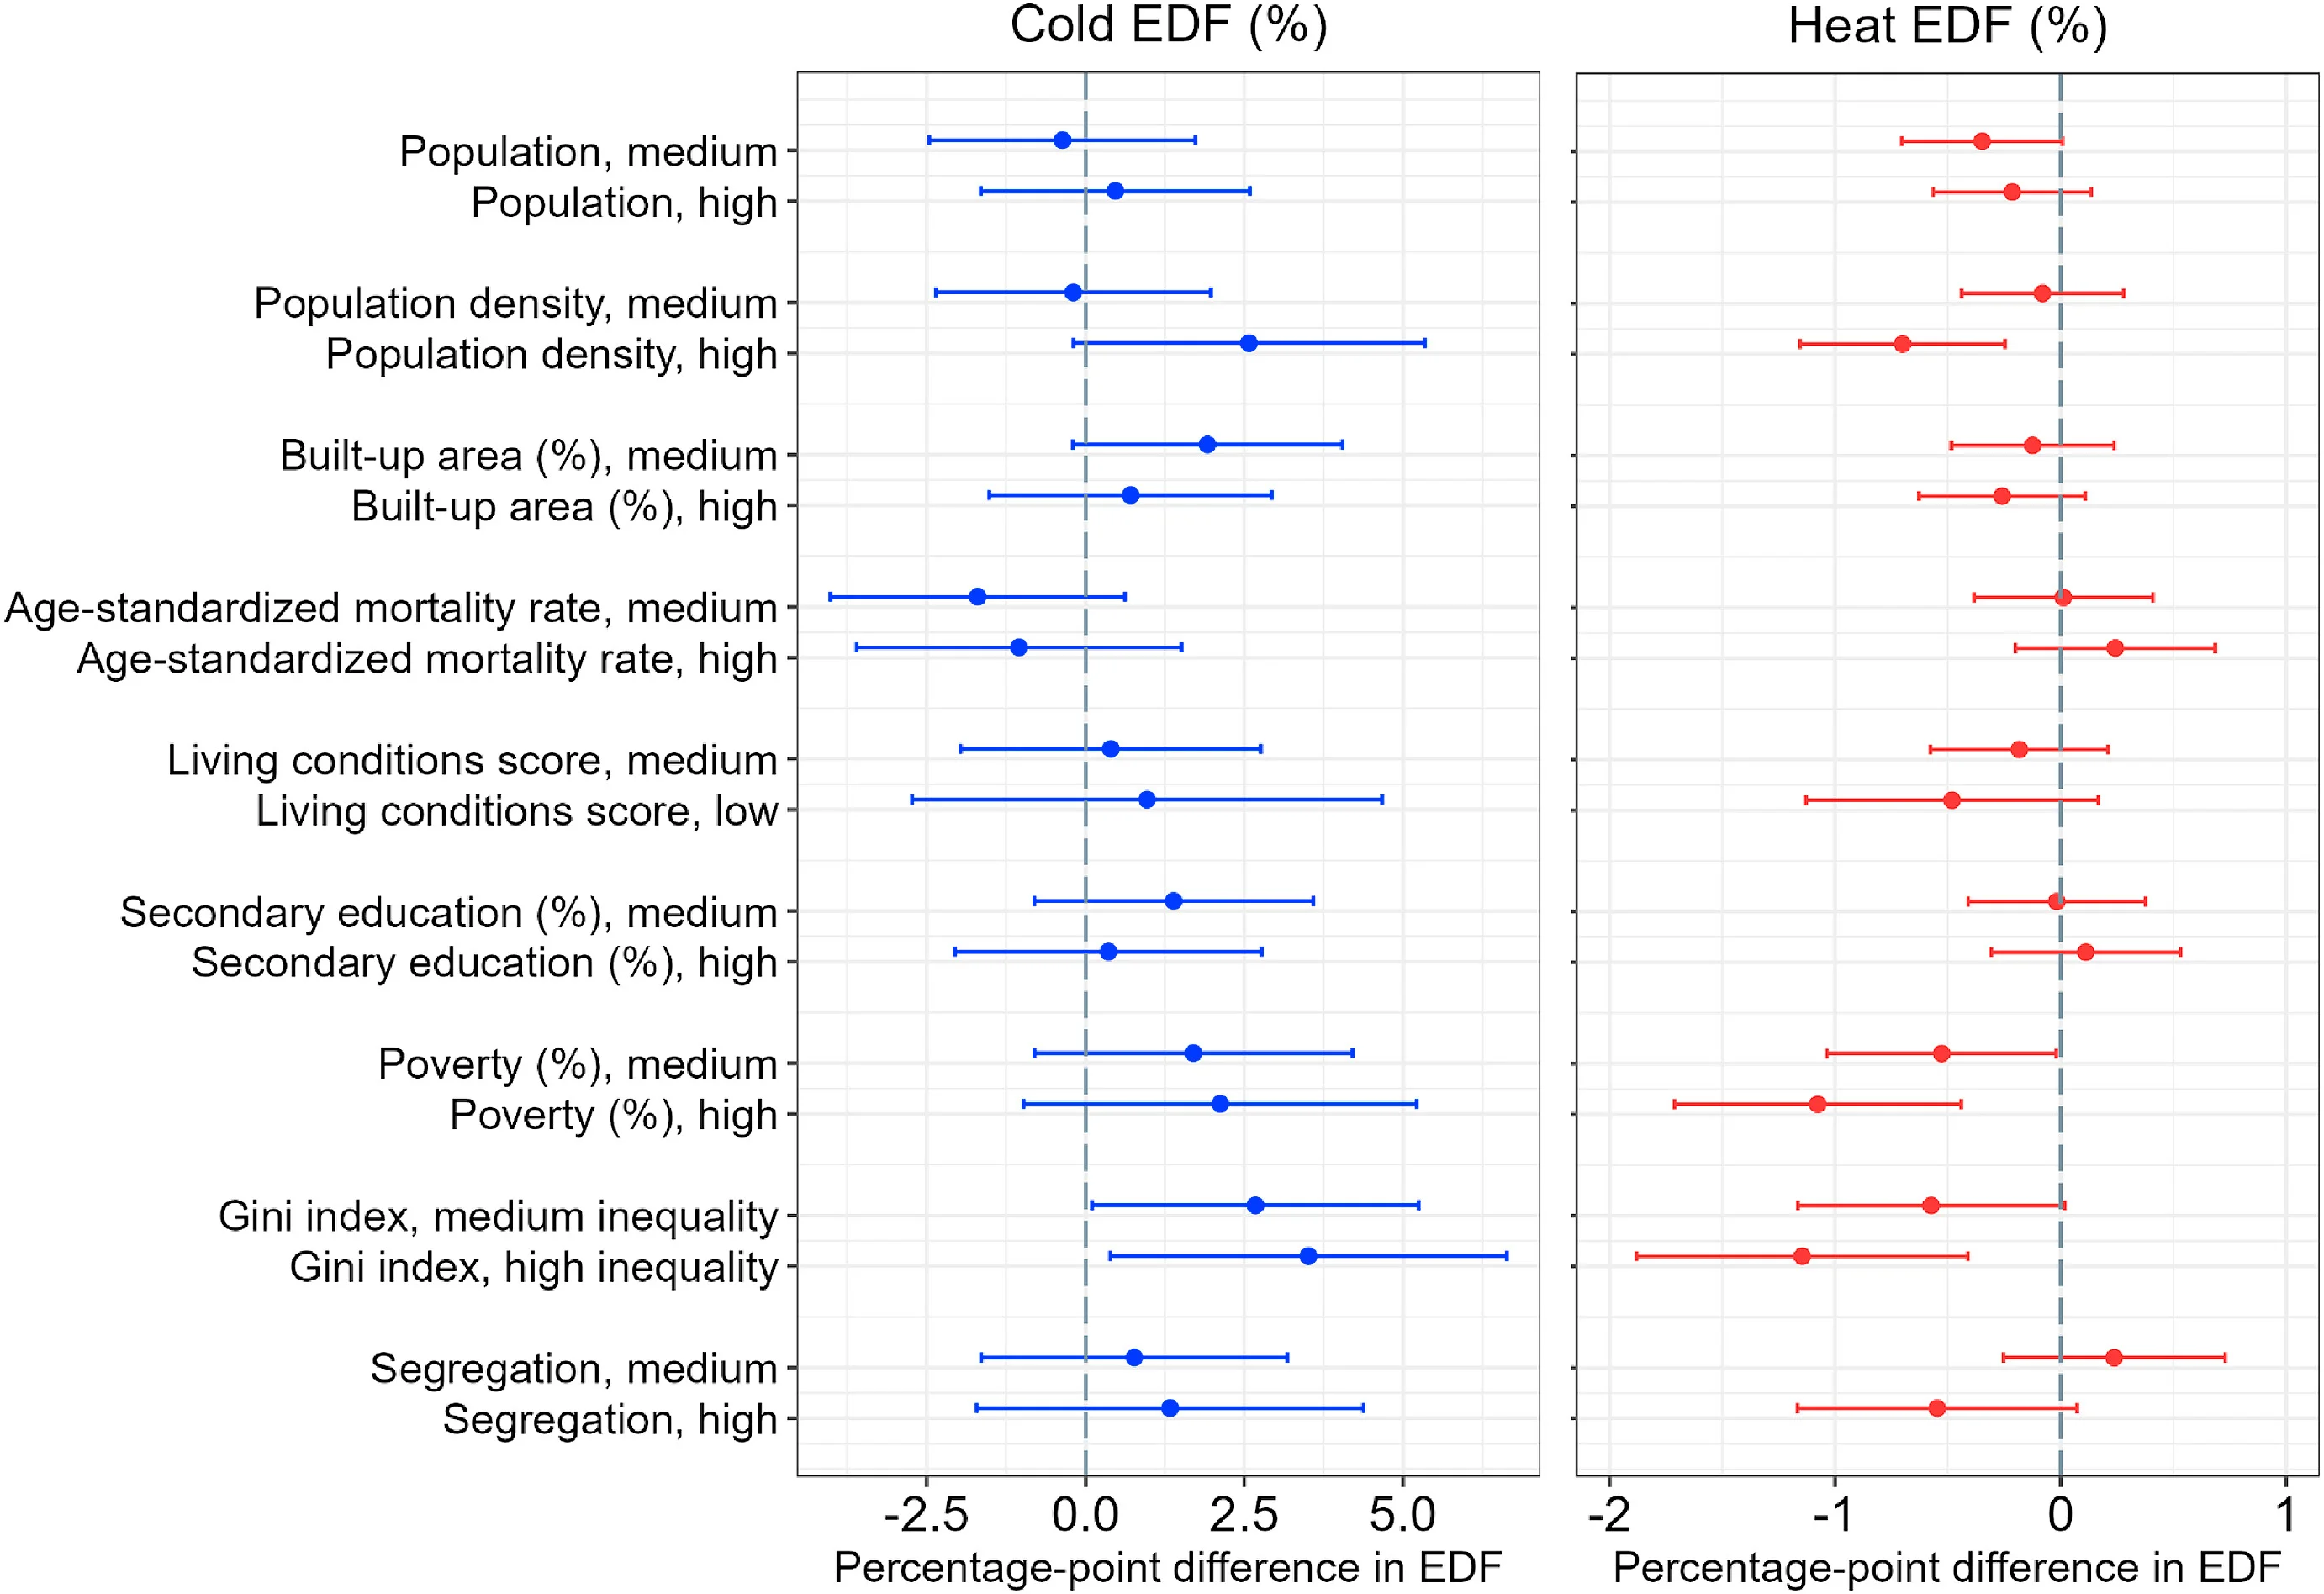
Temperature-related human mortality modification by socioeconomic characteristics in Latin American cities - View full plot details
Environmental health research provides examples of forest plot excellence in epidemiological meta-analysis. The Social Science & Medicine publication investigating temperature mortality (DOI: 10.1016/j.socscimed.2022.115526) employs forest plots to present effect estimates and confidence intervals across different socioeconomic and demographic strata. The visualization demonstrates effect modification patterns while revealing vulnerability disparities that inform climate adaptation and public health policy development.
Cardiovascular Genetics and Disease Risk
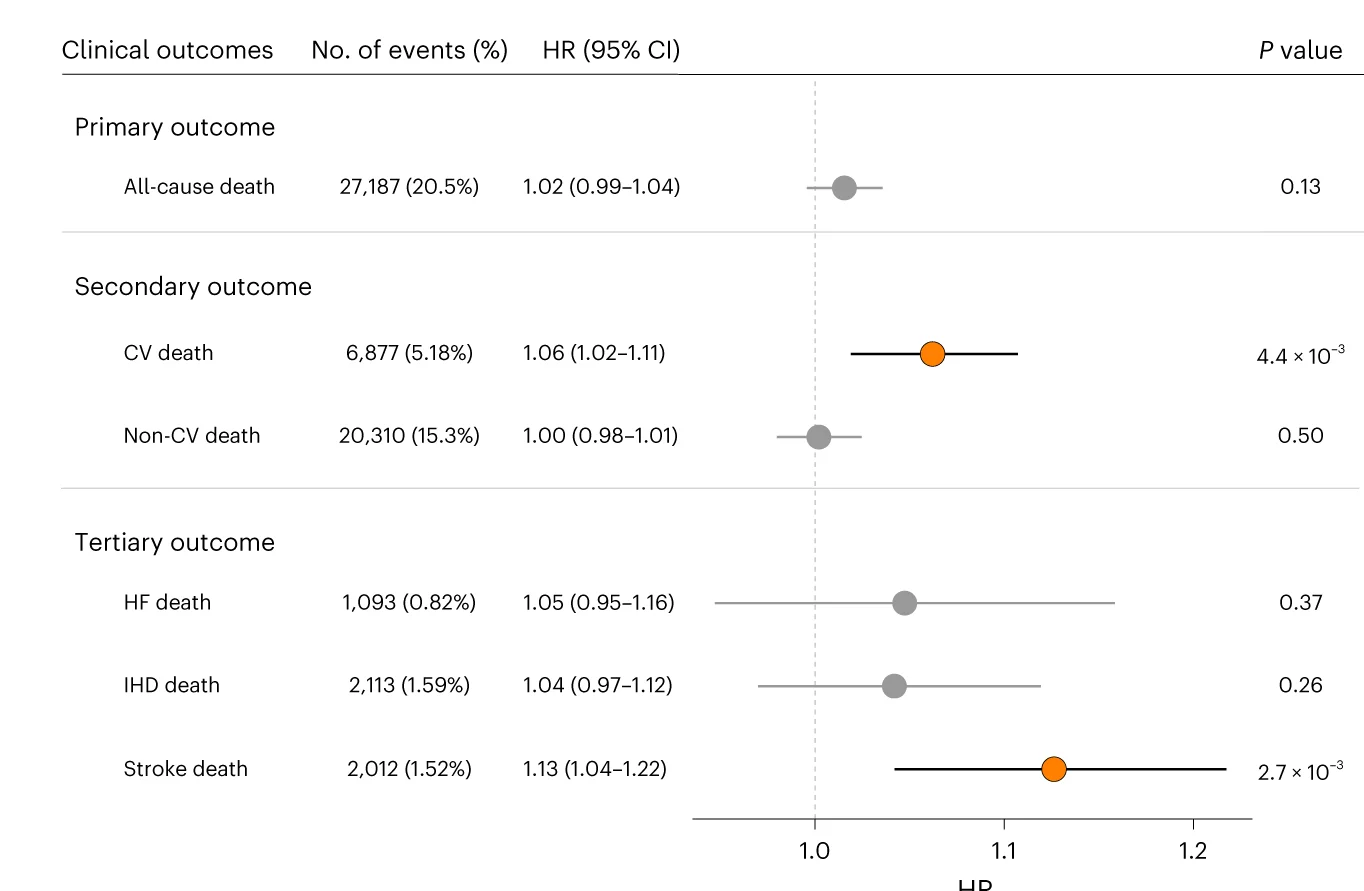
Cross-ancestry genome-wide analysis of atrial fibrillation genetic effects and risk prediction - View full plot details
Cardiovascular genetics research demonstrates sophisticated forest plot implementation for cross-ancestry effect analysis. The Nature Genetics publication investigating atrial fibrillation (DOI: 10.1038/s41588-022-01284-9) uses forest plots to present genetic effect sizes and confidence intervals across different ancestry groups. The researchers effectively reveal ancestry-specific effect patterns while identifying consistent genetic associations that inform cardioembolic risk prediction and precision medicine applications.
Global Biodiversity and Environmental Impact
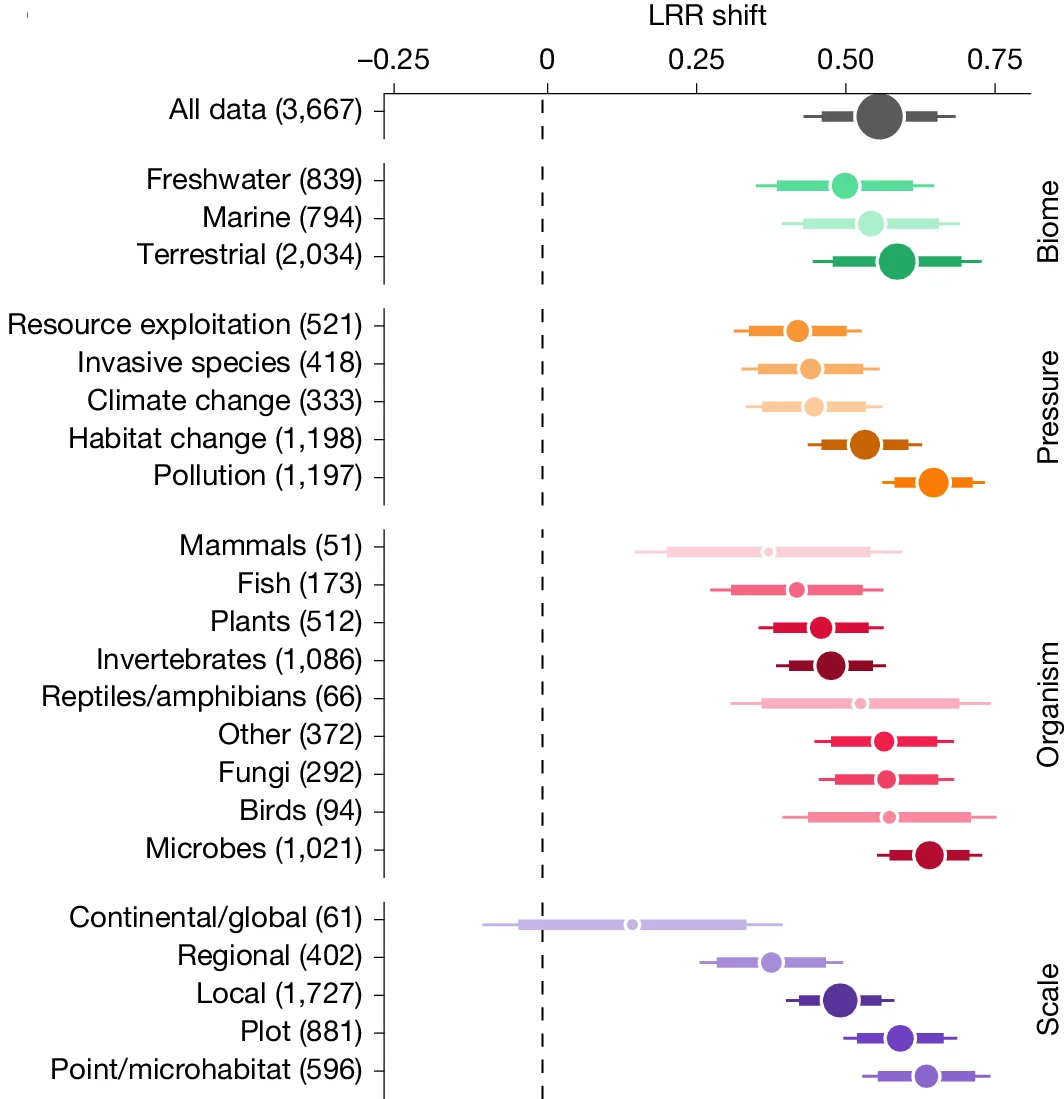
Global human impact on biodiversity: effect size analysis across ecosystems and taxa - View full plot details
Environmental science research showcases forest plot applications for global biodiversity meta-analysis. The Nature publication investigating biodiversity impacts (DOI: 10.1038/s41586-025-08752-2) employs forest plots to present effect sizes and confidence intervals across different ecosystem types and taxonomic groups. The visualization demonstrates consistent impact patterns while revealing ecosystem-specific vulnerabilities that inform conservation strategy prioritization and biodiversity protection policies.
Neuroscience and Perceptual Enhancement
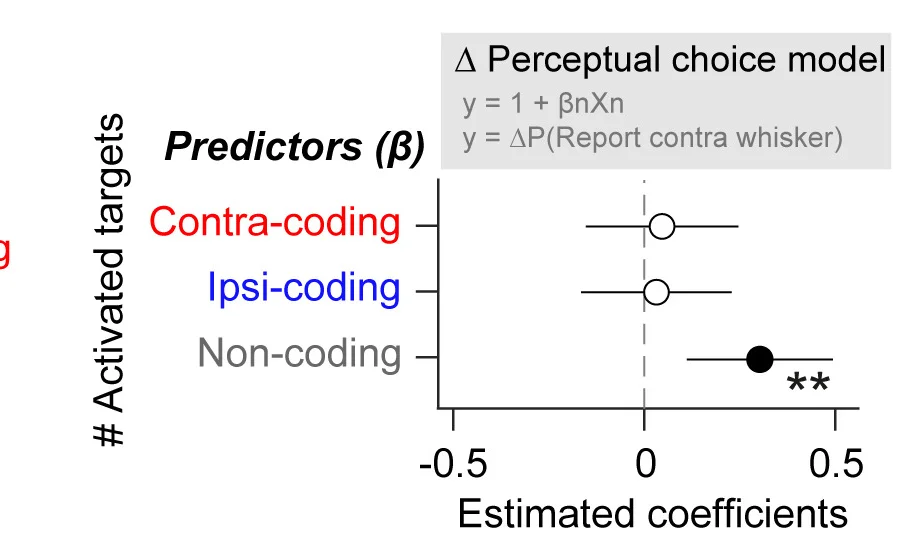
Sensory-evoked inhibition and neural pool recruitment effects on perceptual enhancement - View full plot details
Neuroscience research demonstrates advanced forest plot implementation for neural mechanism analysis. The Neuron publication investigating perceptual enhancement (DOI: 10.1016/j.neuron.2024.04.015) uses forest plots to present effect sizes and confidence intervals across different neural conditions and experimental manipulations. The researchers effectively reveal neural recruitment mechanisms while identifying enhancement strategies that advance understanding of brain plasticity and sensory processing optimization.
Maximizing Evidence Synthesis Impact
Based on my extensive experience implementing forest plots across diverse systematic review contexts, several key principles consistently distinguish exceptional evidence synthesis from merely adequate meta-analysis presentations:
• GRADE Integration and Evidence Certainty Assessment: The most effective forest plot implementations incorporate GRADE methodology, evidence certainty evaluation, and clinical significance assessment that transform statistical pooling into comprehensive evidence evaluation supporting clinical guideline development and healthcare policy decisions. I consistently recommend approaches that integrate evidence quality assessment, clinical expert judgment, and patient preference considerations while maintaining statistical rigor necessary for evidence-based medicine implementation and regulatory decision-making processes.
• Clinical Heterogeneity Exploration and Subgroup Analysis: Context-appropriate forest plot implementation must incorporate comprehensive heterogeneity investigation, prespecified subgroup analysis, and clinical context integration that reveals important effect modifiers and guides evidence application across diverse patient populations and healthcare settings. In my collaborative guideline development projects, I emphasize analytical approaches that balance statistical power considerations with clinical meaningfulness while avoiding overinterpretation of post-hoc subgroup analyses that may not reflect genuine biological or clinical differences.
• Implementation Science and Real-World Evidence Integration: Future-oriented forest plot implementation will increasingly incorporate implementation science frameworks, real-world evidence synthesis, and healthcare system integration considerations that bridge the gap between clinical trial evidence and routine clinical practice through comprehensive evidence evaluation and practical implementation guidance. However, the fundamental principles of rigorous evidence synthesis, appropriate statistical analysis, and clinical context integration will continue to determine the difference between meaningful evidence synthesis and methodologically flawed meta-analysis that cannot support clinical decision-making.
Advancing Your Evidence Synthesis Skills
The forest plot examples featured in our curated collection represent the highest standards of systematic review and meta-analysis methodology, drawn from publications in The Cochrane Database, NEJM, Nature Medicine, and other leading medical journals. Each example demonstrates effective integration of statistical rigor with clinical relevance while advancing evidence-based medicine through sophisticated evidence synthesis approaches.
My analysis of thousands of forest plot implementations across diverse medical specialties has reinforced their critical importance for evidence synthesis and clinical guideline development that drives evidence-based healthcare delivery and therapeutic decision-making. When implemented thoughtfully with attention to statistical accuracy, clinical context, and methodological rigor, forest plots transform scattered clinical evidence into actionable clinical recommendations that advance patient care and healthcare policy development.
I encourage systematic reviewers and clinical researchers to explore our complete curated collection of forest plot examples, where you can discover additional high-quality evidence synthesis visualizations from cutting-edge medical research across multiple therapeutic areas and patient populations. Each plot includes comprehensive methodological documentation and evidence evaluation guidance, enabling you to adapt proven systematic review approaches to your own evidence synthesis challenges and clinical guideline development objectives.
Want to explore more examples of professional forest plot implementation from top-tier systematic reviews? Check out our curated collection at: Forest Plot - featuring dozens of publication-quality meta-analysis visualizations from Cochrane Reviews, NEJM, Nature Medicine, and other leading medical journals, each with complete evidence synthesis methodology details and clinical interpretation examples.
Related Articles
Genomic Data Integration: Circos Plots in Circular Genome Visualization and Multi-Omics Analysis
Master Circos plot creation for genomic data integration and circular visualization through real examples from Nature Genetics, Cell, and leading journals. Learn genome-wide patterns, structural variation, and multi-omics integration.

Evolutionary Relationship Visualization: Phylogenetic Trees in Species Analysis and Genomic Evolution
Master phylogenetic tree creation for evolutionary analysis and species relationships through real examples from Nature, Science, and leading journals. Learn tree topology, branch lengths, and evolutionary inference.
Distribution Comparison Excellence: Ridgeline Plots in Density Analysis and Group Comparison
Master ridgeline plot creation for distribution comparison and density visualization through real examples from Nature, Cell, and leading journals. Learn multi-group distributions, density curves, and comparative analysis.