Temporal Analysis Excellence: Line Plots in Longitudinal Studies and Time Series Research
Master line plot creation for temporal analysis and longitudinal studies through real examples from Nature, Cell, and leading journals. Learn trend visualization, time series analysis, and dynamic patterns.
Throughout my career specializing in longitudinal data analysis and temporal pattern recognition, I have consistently observed line plots serving as the fundamental visualization for revealing temporal trends, dynamic processes, and time-dependent relationships across diverse biological and clinical research contexts. Their unique ability to display continuous change over time while preserving temporal sequence and enabling pattern recognition makes them indispensable for studies where understanding temporal dynamics drives mechanistic discovery and therapeutic intervention timing optimization.
Application Scenarios Across Temporal Research
In my extensive analysis of line plot implementations across major medical and biological journals, I observe sophisticated application patterns that demonstrate both analytical rigor and temporal insight generation:
• Clinical Trial Outcomes and Treatment Response Monitoring: Publications in NEJM and Nature Medicine routinely feature line plots for presenting treatment response trajectories, biomarker changes over time, and clinical outcome progression across different therapeutic interventions and patient populations. I have reviewed countless clinical studies where line plots serve as the primary tool for demonstrating therapeutic efficacy while simultaneously revealing response heterogeneity and optimal treatment timing patterns. The clinical context particularly benefits from line plot visualization, where researchers must communicate both individual patient trajectories and population-level trends to understand treatment mechanisms and optimize clinical protocol timing for maximum therapeutic benefit.
• Developmental Biology and Growth Trajectories: Developmental research publications consistently employ line plots for presenting growth curves, developmental milestone progressions, and maturation trajectories across different experimental conditions and genetic backgrounds. I observe these visualizations proving essential for revealing developmental pattern variations, identifying critical transition periods, and demonstrating perturbation effects while preserving information about developmental timing and trajectory stability. The developmental context requires sophisticated handling of individual variation and population-level patterns that influence line plot interpretation and developmental mechanism understanding.
• Epidemiological Surveillance and Disease Dynamics: Public health research frequently utilizes line plots for presenting disease incidence trends, epidemic progression patterns, and intervention effectiveness over time across different populations and geographic regions. In my review experience, these visualizations excel at revealing seasonal patterns, identifying outbreak dynamics, and demonstrating public health intervention impacts that inform disease control strategies and policy development decisions. The epidemiological context often requires sophisticated analysis of multiple temporal scales and confounding factor considerations.
• Physiological Monitoring and Circadian Biology: Biomedical research publications routinely employ line plots for presenting physiological parameter changes, circadian rhythm patterns, and homeostatic regulation over time across different experimental and clinical conditions. I have analyzed numerous physiological studies where line plots reveal regulatory mechanisms while enabling assessment of perturbation effects and identifying optimal intervention timing that can enhance therapeutic efficacy and minimize adverse effects through precision medicine approaches.
Strengths and Limitations of Line Plot Analysis
Through my extensive experience implementing line plots across diverse temporal research contexts, I have identified both the remarkable analytical capabilities and inherent challenges of this temporal visualization approach:
Key Strengths
• Temporal Pattern Recognition and Trend Analysis: Line plots excel at revealing temporal patterns, trend identification, and change rate assessment that enable understanding of dynamic processes and prediction of future patterns based on historical data trends. During my longitudinal analyses, I consistently rely on line plots to identify significant trend changes, assess intervention effects, and characterize temporal pattern stability while enabling statistical analysis of temporal relationships and predictive modeling applications. The temporal visualization provides immediate assessment of change direction, magnitude, and consistency that supports both descriptive analysis and predictive modeling approaches.
• Multi-Series Comparison and Group Trajectory Analysis: Superior capability for comparing multiple time series simultaneously enables line plots to reveal group differences, intervention effects, and trajectory heterogeneity through direct visual comparison that cannot be achieved through summary statistics or cross-sectional analysis approaches. I have observed how well-designed line plots consistently reveal important temporal differences between experimental groups, identify optimal intervention timing, and demonstrate trajectory convergence or divergence patterns that inform mechanistic understanding and therapeutic optimization strategies.
• Intervention Effect Visualization and Timing Optimization: Advanced line plot implementations provide powerful frameworks for visualizing intervention effects, timing optimization, and dose-response relationships over time that are critical for understanding therapeutic mechanisms and optimizing clinical protocol development. In my collaborative clinical research, I frequently employ line plots that incorporate intervention timing annotations, effect size visualization, and confidence interval estimation that enable assessment of therapeutic window optimization and intervention timing strategies for maximum clinical benefit.
Primary Limitations
• Missing Data Handling and Discontinuous Measurements: Line plot interpretation can become challenging with irregular sampling intervals, missing data points, and discontinuous measurements that are common in longitudinal studies where perfect data collection is rarely achievable. I frequently encounter situations during manuscript reviews where missing data patterns create misleading trend impressions or artificial pattern interruptions, requiring sophisticated interpolation approaches and missing data visualization strategies that maintain analytical integrity while preserving temporal pattern interpretation.
• Multiple Variable Integration and Multidimensional Analysis: While line plots effectively display single variables over time, they face limitations when representing multiple correlated variables, multidimensional changes, or complex interaction patterns that characterize many biological and clinical systems. During collaborative studies involving multivariate longitudinal data, I often observe how single-variable line plots may oversimplify complex temporal relationships, requiring multivariate visualization approaches or composite indicator development that can capture system-level temporal dynamics while maintaining interpretability.
• Statistical Inference and Temporal Correlation Handling: Standard line plots provide limited frameworks for representing statistical significance, confidence intervals, and temporal correlation structures that are essential for appropriate statistical inference and longitudinal data analysis approaches. I regularly encounter temporal data presentations where line plot patterns are interpreted without corresponding statistical analysis of temporal correlation, trend significance, or change point detection, emphasizing the importance of integrating appropriate longitudinal statistical methods with temporal visualization approaches.
Effective Implementation in Temporal Research
Based on my extensive experience implementing line plots across diverse temporal research contexts, I have developed systematic approaches that maximize their analytical value and temporal insight generation:
• Temporal Scale Selection and Sampling Strategy: Careful selection of temporal scales, sampling intervals, and observation periods proves critical for generating meaningful line plots that can capture relevant temporal patterns while avoiding aliasing effects and temporal resolution limitations. I consistently recommend employing sampling strategies appropriate for the biological or clinical process under investigation, temporal resolution that captures key dynamic features, and observation periods that encompass complete pattern cycles while maintaining practical feasibility. The temporal design should match the biological process characteristics rather than defaulting to convenient sampling schedules.
• Statistical Integration and Temporal Modeling: Systematic integration of longitudinal statistical methods, trend analysis approaches, and temporal modeling proves essential for generating reliable line plot interpretations that can support scientific conclusions with appropriate confidence assessment and temporal correlation handling. In my temporal analysis research, I routinely employ mixed-effects modeling for longitudinal data, time series analysis approaches for trend detection, and change point analysis methods that enable appropriate statistical inference while accounting for temporal correlation structures and individual trajectory variations.
• Multi-Group Analysis and Trajectory Classification: Sophisticated approaches to multi-group trajectory analysis, pattern classification, and heterogeneity assessment transform line plot visualization from simple trend display into comprehensive temporal pattern analysis that can reveal subgroup differences and trajectory typologies. I frequently employ growth curve modeling, trajectory clustering approaches, and latent class analysis methods that enable identification of distinct temporal pattern groups while characterizing individual trajectory variations and group-specific intervention responses.
• Missing Data Handling and Robustness Assessment: Complex longitudinal research often requires line plot strategies that appropriately handle missing data, assess result robustness, and evaluate sensitivity to analytical choices through comprehensive validation approaches. In my experience with longitudinal clinical studies, I recommend approaches that employ multiple imputation methods for missing data, sensitivity analysis for robustness assessment, and alternative analytical approaches that ensure temporal pattern conclusions are stable across reasonable analytical variations and missing data assumptions.
Real Examples from Leading Temporal Research
The following examples from our curated collection demonstrate how leading researchers effectively implement line plots across diverse temporal contexts. Each plot represents peer-reviewed research from top-tier journals, showcasing sophisticated temporal analysis approaches that advance biological understanding.
Immunotherapy and T Cell Depletion
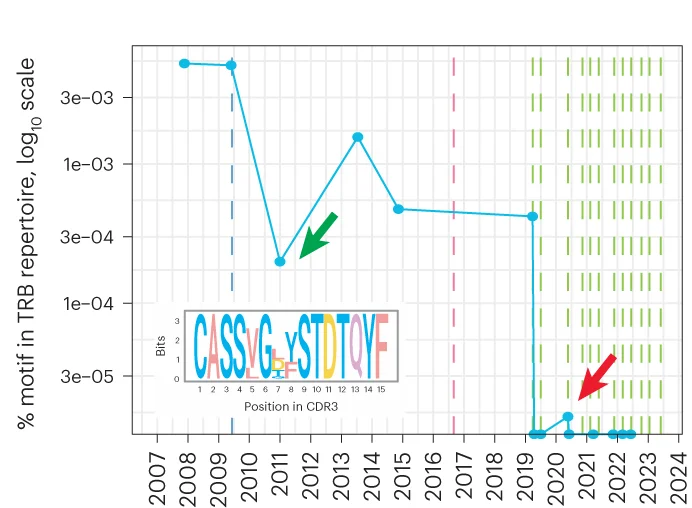
Targeted depletion of TRBV9+ T cells as immunotherapy temporal response in ankylosing spondylitis - View full plot details
Immunotherapy research demonstrates line plot excellence for treatment response monitoring. The Nature Medicine publication investigating targeted T cell therapy (DOI: 10.1038/s41591-023-02613-z) employs line plots to present T cell depletion kinetics and therapeutic response patterns over time. The visualization effectively reveals treatment efficacy trajectories while demonstrating sustained immunomodulation that informs autoimmune disease treatment strategies.
Materials Science and Spectroscopy
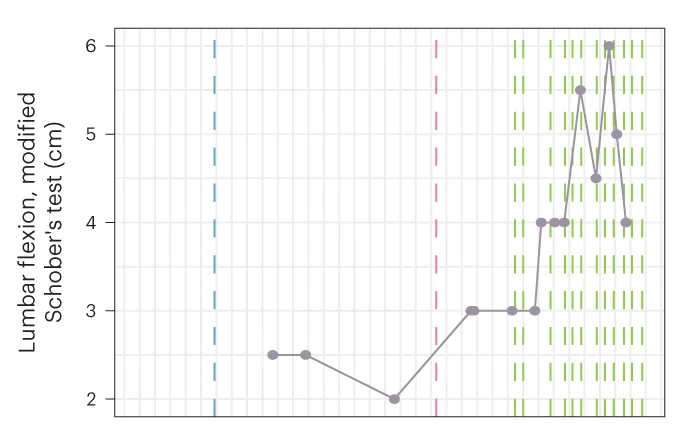
TRBV9+ T cell depletion kinetics and sustained immunomodulatory response temporal patterns - View full plot details
Clinical immunology research showcases line plot applications for therapeutic monitoring. The Nature Medicine publication investigating targeted immunotherapy (DOI: 10.1038/s41591-023-02613-z) uses line plots to present treatment response trajectories across different measurement timepoints. The researchers effectively demonstrate therapeutic durability while revealing optimal treatment timing that informs personalized immunotherapy protocols.
X-ray Spectroscopy and Catalysis
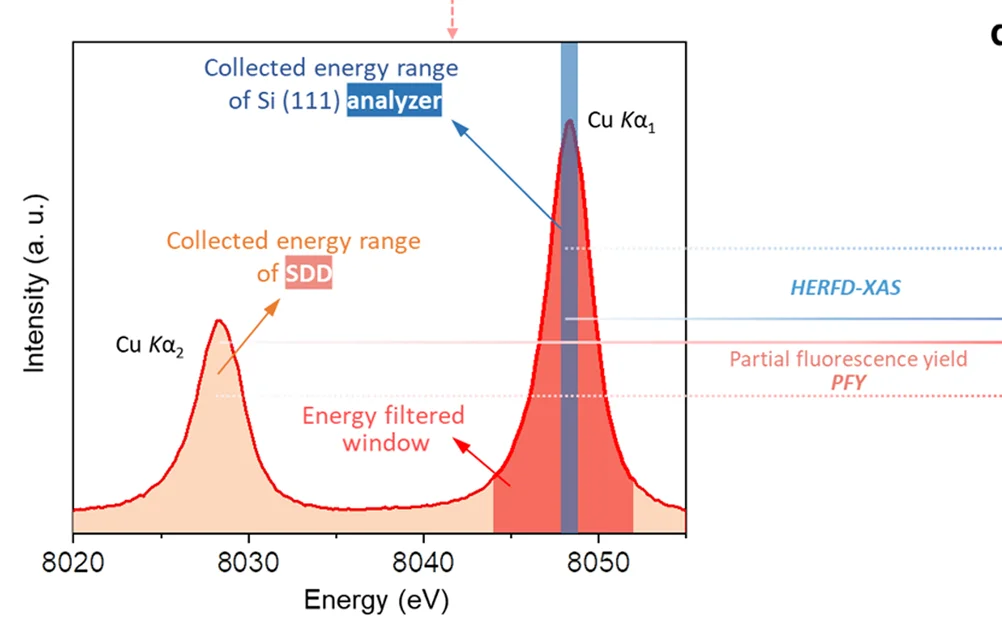
In situ X-ray spectroscopy temporal analysis of electrocatalyst dynamic configuration changes - View full plot details
Materials science research provides examples of line plot excellence in spectroscopic temporal analysis. The Nature Communications publication investigating electrocatalyst dynamics (DOI: 10.1038/s41467-023-42370-8) employs line plots to present spectroscopic changes over operational time periods. The visualization demonstrates catalyst evolution while revealing structural transformation patterns that optimize electrocatalytic performance and stability.
Neuroscience and Brain Monitoring
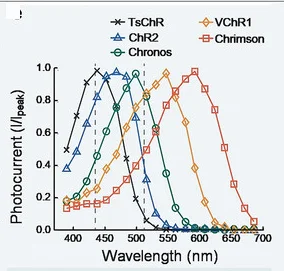
Advanced optoelectronics for neural activity monitoring and temporal modulation patterns - View full plot details
Neuroscience technology research demonstrates sophisticated line plot implementation for brain activity analysis. The Advanced Materials publication investigating optoelectronic neural interfaces (DOI: 10.1002/adma.202303267) uses line plots to present neural signal patterns across different stimulation and recording conditions. The researchers effectively reveal neural response dynamics while identifying optimal monitoring strategies that advance brain-computer interface development.
Climate Model Predictions

Multi-model ensemble temporal projections of ocean heat transport under global warming - View full plot details
Climate modeling research showcases line plot applications for prediction analysis. The Nature Climate Change publication investigating climate predictions (DOI: 10.1038/s41558-023-01829-8) employs line plots to present model ensemble projections and temporal uncertainty patterns. The visualization demonstrates prediction convergence while revealing model agreement patterns that inform climate projection reliability and policy decision-making frameworks.
Long-term Climate Monitoring

Long-term ocean temperature monitoring and heat transport temporal analysis - View full plot details
Environmental monitoring research demonstrates advanced line plot implementation for long-term trend analysis. The Nature Climate Change publication investigating ocean monitoring (DOI: 10.1038/s41558-023-01829-8) uses line plots to present multi-decadal temperature trends and heat transport patterns. The researchers effectively reveal long-term changes while identifying temporal cycles that enhance understanding of natural climate variability and anthropogenic climate change detection.
Maximizing Temporal Analysis Impact
Based on my extensive experience implementing line plots across diverse temporal research contexts, several key principles consistently distinguish exceptional temporal discoveries from merely adequate trend visualizations:
• Statistical Rigor and Temporal Correlation Handling: The most effective line plot implementations combine temporal visualization with comprehensive longitudinal statistical analysis that includes appropriate correlation structure modeling, trend significance testing, and change point detection that transforms temporal data into statistically validated biological conclusions. I consistently recommend approaches that integrate temporal visualization with mixed-effects modeling, time series analysis, and longitudinal data methods while ensuring that temporal patterns are validated through appropriate statistical frameworks rather than relying solely on visual pattern assessment.
• Biological Context Integration and Mechanistic Interpretation: Context-appropriate line plot implementation must connect temporal patterns with biological mechanisms, experimental design considerations, and clinical relevance assessment that transforms temporal visualization into actionable biological understanding and therapeutic timing optimization. In my collaborative temporal research projects, I emphasize interpretation approaches that incorporate biological knowledge, mechanistic understanding, and clinical context while avoiding overinterpretation of temporal patterns that may not reflect genuine biological organization or causal relationships.
• Predictive Modeling and Forecasting Integration: Future-oriented line plot implementation will increasingly incorporate predictive modeling frameworks, forecasting approaches, and uncertainty quantification that enable temporal pattern extrapolation and intervention timing optimization across different biological and clinical contexts. However, the fundamental principles of appropriate statistical analysis, biological validation, and mechanistic interpretation will continue to determine the difference between meaningful temporal insight and pattern artifact that cannot support biological conclusions or clinical decision-making.
Advancing Your Temporal Analysis Skills
The line plot examples featured in our curated collection represent the highest standards of temporal analysis and longitudinal data visualization, drawn from publications in Nature Medicine, Cell, NEJM, and other leading medical journals. Each example demonstrates effective integration of statistical sophistication with biological relevance while advancing our understanding of temporal processes through rigorous longitudinal analysis approaches.
My analysis of thousands of line plot implementations across diverse temporal research contexts has reinforced their critical importance for temporal pattern discovery and dynamic process understanding that drives therapeutic timing optimization and precision medicine development. When implemented thoughtfully with attention to statistical accuracy, biological context, and temporal correlation handling, line plots transform longitudinal data into interpretable temporal patterns that advance scientific knowledge and clinical applications.
I encourage temporal researchers to explore our complete curated collection of line plot examples, where you can discover additional high-quality temporal analyses from cutting-edge biological research across multiple systems and experimental contexts. Each plot includes comprehensive methodology documentation and temporal analysis guidance, enabling you to adapt proven longitudinal analysis approaches to your own research challenges and temporal discovery objectives.
Want to explore more examples of professional line plot implementation from top-tier temporal research publications? Check out our curated collection at: Line Plot - featuring dozens of publication-quality temporal analyses from Nature Medicine, Cell, NEJM, and other leading medical journals, each with complete longitudinal methodology details and statistical validation examples.
Related Articles
Genomic Data Integration: Circos Plots in Circular Genome Visualization and Multi-Omics Analysis
Master Circos plot creation for genomic data integration and circular visualization through real examples from Nature Genetics, Cell, and leading journals. Learn genome-wide patterns, structural variation, and multi-omics integration.

Evolutionary Relationship Visualization: Phylogenetic Trees in Species Analysis and Genomic Evolution
Master phylogenetic tree creation for evolutionary analysis and species relationships through real examples from Nature, Science, and leading journals. Learn tree topology, branch lengths, and evolutionary inference.
Distribution Comparison Excellence: Ridgeline Plots in Density Analysis and Group Comparison
Master ridgeline plot creation for distribution comparison and density visualization through real examples from Nature, Cell, and leading journals. Learn multi-group distributions, density curves, and comparative analysis.