Model Performance Visualization: ROC Curves in Machine Learning Research Publications
Master ROC curve analysis for diagnostic and predictive modeling through real examples from Nature Medicine, Cell, and leading medical journals. Learn sensitivity, specificity, and AUC interpretation.
Throughout my career developing diagnostic algorithms and evaluating predictive models in biomedical research, I have consistently observed ROC (Receiver Operating Characteristic) curves serving as the definitive standard for assessing classifier performance and diagnostic accuracy across diverse clinical applications. Their unique ability to simultaneously visualize sensitivity and specificity trade-offs while providing quantitative performance metrics through area under the curve (AUC) analysis makes them indispensable for studies where model validation drives clinical decision-making and regulatory approval processes.
Application Scenarios Across Biomedical Research
In my extensive analysis of ROC curve implementations across major medical and computational biology journals, I observe sophisticated application patterns that demonstrate both analytical rigor and clinical relevance:
• Diagnostic Biomarker Development and Validation: Publications in Nature Medicine and The Lancet consistently feature ROC curves for presenting diagnostic accuracy of novel biomarkers, imaging algorithms, and multi-parameter clinical scores across diverse disease contexts and patient populations. I have reviewed countless diagnostic studies where ROC curves serve as the primary tool for establishing clinical utility while simultaneously demonstrating performance across different patient subgroups and disease severity levels. The diagnostic context particularly benefits from ROC visualization, where clinicians must balance sensitivity and specificity requirements based on clinical consequences of false positive and false negative results.
• Machine Learning Model Validation and Clinical AI: Computational medicine research publications routinely employ ROC curves for presenting deep learning model performance, predictive algorithm validation, and clinical decision support system evaluation across diverse medical specialties and computational approaches. I observe these visualizations proving essential for demonstrating model generalizability, comparing algorithm performance, and establishing clinical deployment readiness through rigorous validation across independent datasets and diverse patient populations.
• Drug Response Prediction and Precision Medicine: Pharmacological research frequently utilizes ROC curves for presenting treatment response prediction models, adverse event risk stratification, and personalized therapy selection algorithms across different patient populations and therapeutic interventions. In my review experience, these visualizations excel at demonstrating precision medicine model performance while enabling clinicians to assess the clinical utility of molecular biomarkers and computational prediction tools for therapeutic decision-making.
• Cancer Biology and Immunotherapy Response: Oncological research publications consistently employ ROC curves for presenting tumor classification algorithms, immunotherapy response prediction models, and prognostic biomarker validation across different cancer types and treatment modalities. I have analyzed numerous cancer studies where ROC curves reveal predictive model performance while enabling assessment of biomarker clinical utility for patient stratification and treatment selection in precision oncology applications.
Strengths and Limitations of ROC Curve Analysis
Through my extensive experience implementing ROC analyses across diverse biomedical research contexts, I have identified both the remarkable analytical capabilities and inherent challenges of this performance assessment approach:
Key Strengths
• Threshold-Independent Performance Assessment: ROC curves excel at providing comprehensive model performance evaluation across all possible classification thresholds, enabling identification of optimal operating points that balance sensitivity and specificity requirements based on specific clinical applications and cost considerations. During my diagnostic algorithm development, I consistently rely on ROC analysis to identify clinically appropriate thresholds that optimize diagnostic accuracy while accounting for clinical consequences of misclassification errors. The threshold-independent nature provides complete performance characterization that supports clinical decision-making and regulatory submission requirements.
• Model Comparison and Statistical Validation: Superior capability for comparing multiple diagnostic models or biomarker combinations enables ROC analysis to identify the most effective approaches while providing statistical frameworks for performance comparison and validation across independent datasets. I have observed how ROC curve comparison consistently reveals superior diagnostic approaches while enabling statistical testing of performance differences that support evidence-based clinical implementation and regulatory approval decisions.
• Clinical Interpretability and Decision Support: Advanced ROC implementations provide intuitive visualization of diagnostic trade-offs that can be directly interpreted by clinicians and translated into clinical decision support tools that enhance patient care and diagnostic accuracy. In my collaborative clinical research, I frequently employ ROC curves that incorporate clinical cost considerations, prevalence adjustments, and decision threshold optimization that enable direct translation of research findings into clinical practice guidelines and diagnostic protocols.
Primary Limitations
• Class Imbalance Sensitivity and Prevalence Dependence: ROC curve interpretation becomes challenging when dealing with highly imbalanced datasets common in rare disease diagnosis or screening applications, where traditional AUC metrics may provide overly optimistic performance estimates that do not reflect real-world clinical utility. I frequently encounter situations during manuscript reviews where ROC analyses of rare disease biomarkers suggest excellent diagnostic performance that cannot be validated in real-world clinical settings with lower disease prevalence and different patient population characteristics.
• Multi-Class and Complex Diagnostic Scenarios: Standard ROC analysis is limited to binary classification problems and may not adequately address complex diagnostic scenarios involving multiple disease subtypes, severity levels, or treatment response categories that require more sophisticated performance evaluation approaches. During collaborative clinical research involving complex diagnostic challenges, I often observe how binary ROC analysis oversimplifies clinical decision-making requirements that involve multiple diagnostic categories and treatment pathway selection rather than simple positive-negative classification decisions.
• Clinical Context and Cost-Benefit Integration: ROC curves alone cannot incorporate clinical costs, patient preferences, and healthcare system considerations that critically influence appropriate threshold selection and diagnostic implementation decisions in real-world clinical settings. I regularly encounter diagnostic studies where ROC analysis suggests optimal thresholds that become inappropriate when clinical implementation costs, patient burden, and healthcare resource allocation considerations are incorporated into diagnostic decision-making frameworks.
Effective Implementation in Biomedical Research
Based on my extensive experience implementing ROC analyses across diverse biomedical research contexts, I have developed systematic approaches that maximize their clinical utility and regulatory acceptance:
• Validation Strategy and Dataset Independence: Rigorous validation approaches using independent datasets, cross-validation frameworks, and external validation cohorts prove critical for generating reliable performance estimates that can be translated into clinical applications with appropriate confidence intervals and generalizability assessment. I consistently recommend validation strategies that incorporate multiple independent datasets, temporal validation across different time periods, and geographic validation across different healthcare systems to ensure diagnostic model robustness and clinical applicability.
• Statistical Testing and Confidence Interval Estimation: Sophisticated statistical approaches to ROC curve comparison, confidence interval estimation, and performance significance testing transform simple performance visualization into comprehensive statistical analyses that support regulatory submission and clinical guideline development. In my diagnostic research, I routinely employ bootstrap confidence intervals, DeLong statistical testing for AUC comparison, and power analysis approaches that ensure appropriate sample sizes for reliable performance estimation and regulatory acceptance.
• Clinical Context Integration and Threshold Optimization: Systematic integration of clinical costs, patient outcomes, and healthcare system considerations with ROC analysis enables identification of clinically optimal operating points that reflect real-world diagnostic requirements rather than purely statistical performance metrics. I frequently incorporate clinical decision analysis, cost-effectiveness modeling, and patient outcome integration that optimize diagnostic thresholds for clinical implementation while maintaining statistical rigor and regulatory compliance requirements.
• Multi-Modal Integration and Ensemble Approaches: Complex diagnostic challenges often require ROC analysis strategies that accommodate multiple biomarker types, imaging modalities, and clinical variables through ensemble modeling and multi-modal integration approaches that maximize diagnostic accuracy while maintaining clinical interpretability. In my experience with multi-omics diagnostic development, I recommend approaches that employ weighted ensemble methods, feature selection optimization, and cross-modal validation strategies that maximize diagnostic performance while avoiding overfitting and maintaining clinical applicability.
Real Examples from Leading Biomedical Research
The following examples from our curated collection demonstrate how leading researchers effectively implement ROC curves across diverse biomedical contexts. Each plot represents peer-reviewed research from top-tier medical journals, showcasing sophisticated performance analysis approaches that advance clinical diagnostics and therapeutic decision-making.
Pediatric Oncology and Precision Medicine

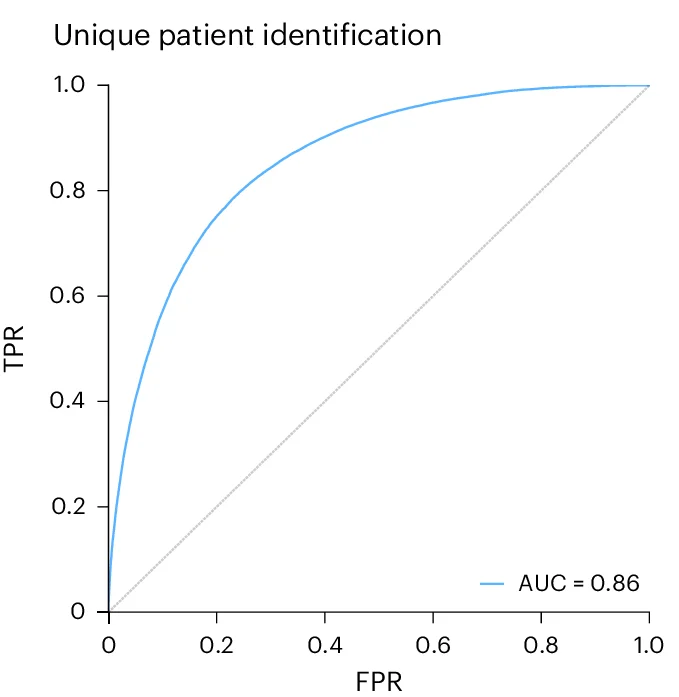
Systems-level immunomonitoring diagnostic performance in pediatric solid tumors - View full plot details
Pediatric oncology research demonstrates ROC curve excellence for precision medicine applications. The Cell publication investigating immunomonitoring in pediatric cancer (DOI: 10.1016/j.cell.2024.12.014) employs ROC curves to present diagnostic accuracy of immune profiling approaches for treatment response prediction. The visualization effectively demonstrates how multi-parameter immune monitoring can predict therapeutic outcomes while providing clinically relevant performance metrics for pediatric precision oncology implementation.
Cancer Immunology and Biomarker Discovery

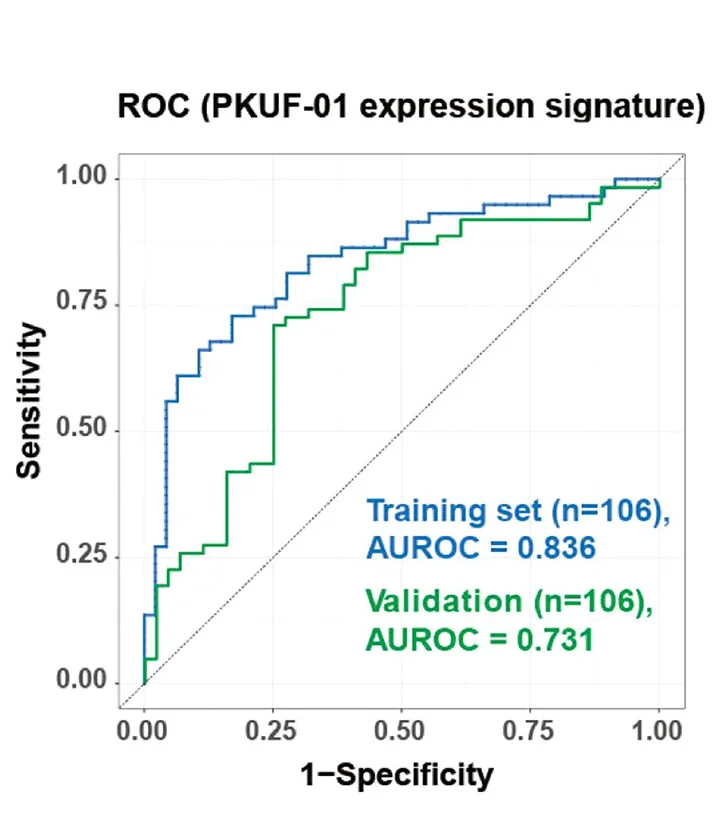
TIL-specific gene signature diagnostic accuracy across diverse cancer types - View full plot details
Cancer immunology research showcases ROC curve applications for biomarker validation studies. The Nature Communications publication investigating tumor-infiltrating lymphocyte signatures (DOI: 10.1038/s41467-024-55059-3) uses ROC curves to present diagnostic performance of minimal gene sets for TIL identification across multiple cancer types. The researchers effectively demonstrate cross-cancer generalizability while providing performance validation that supports clinical implementation of immune monitoring approaches.
Medical AI and Clinical Decision Support
Vision-language foundation model diagnostic accuracy for echocardiogram analysis - View full plot details
Medical artificial intelligence research provides examples of ROC curve excellence in clinical AI validation. The Nature Medicine publication investigating vision-language models for echocardiography (DOI: 10.1038/s41591-024-02959-y) employs ROC curves to present diagnostic accuracy across different cardiac conditions and imaging protocols. The visualization demonstrates how foundation models achieve clinical-grade diagnostic performance while providing transparency necessary for clinical deployment and regulatory approval.
Pharmacogenomics and Drug Response Prediction
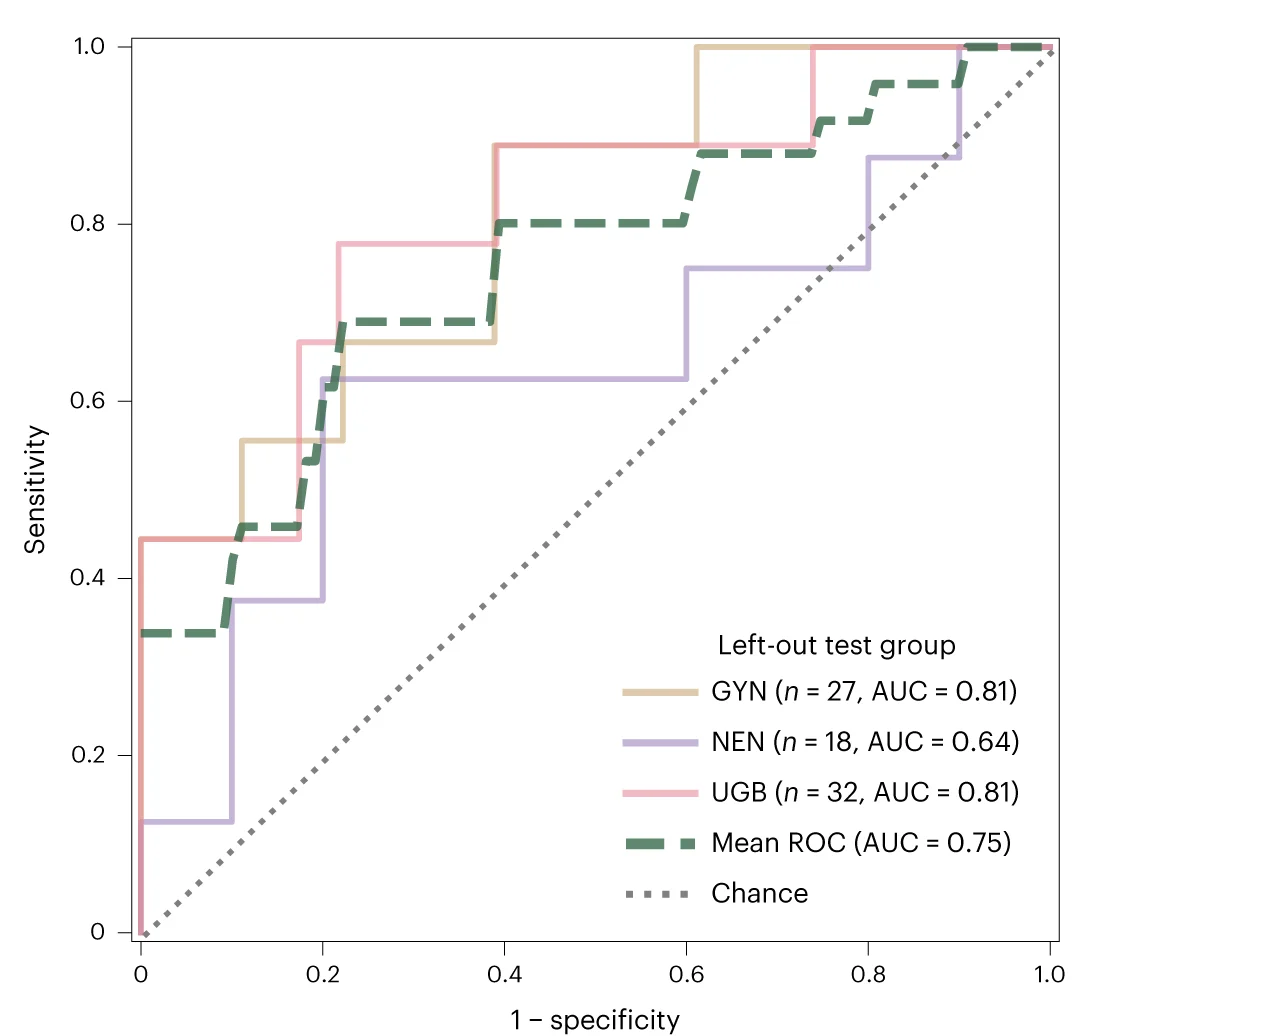
Pharmacogenomic profiling accuracy for predicting drug response in liver cancer organoids - View full plot details
Pharmacogenomics research demonstrates sophisticated ROC curve implementation for drug response prediction. The Cancer Cell publication investigating liver cancer organoid biobanking (DOI: 10.1016/j.ccell.2024.03.004) uses ROC curves to present predictive accuracy of molecular profiling for therapeutic response across different drug classes and patient populations. The researchers effectively demonstrate precision medicine model performance while enabling assessment of clinical implementation potential.
Microbiome and Immunotherapy Response
Gut microbial signature diagnostic accuracy for immunotherapy response prediction - View full plot details
Microbiome research showcases ROC curve applications for immunotherapy response prediction. The Nature Medicine publication investigating gut microbial signatures (DOI: 10.1038/s41591-024-02823-z) employs ROC curves to present predictive accuracy of microbiome profiling for combination immune checkpoint blockade response across multiple cancer types. The visualization demonstrates cross-cancer applicability while providing performance metrics for clinical implementation of microbiome-based precision medicine.
Neutrophil Biology and Immunotherapy Biomarkers
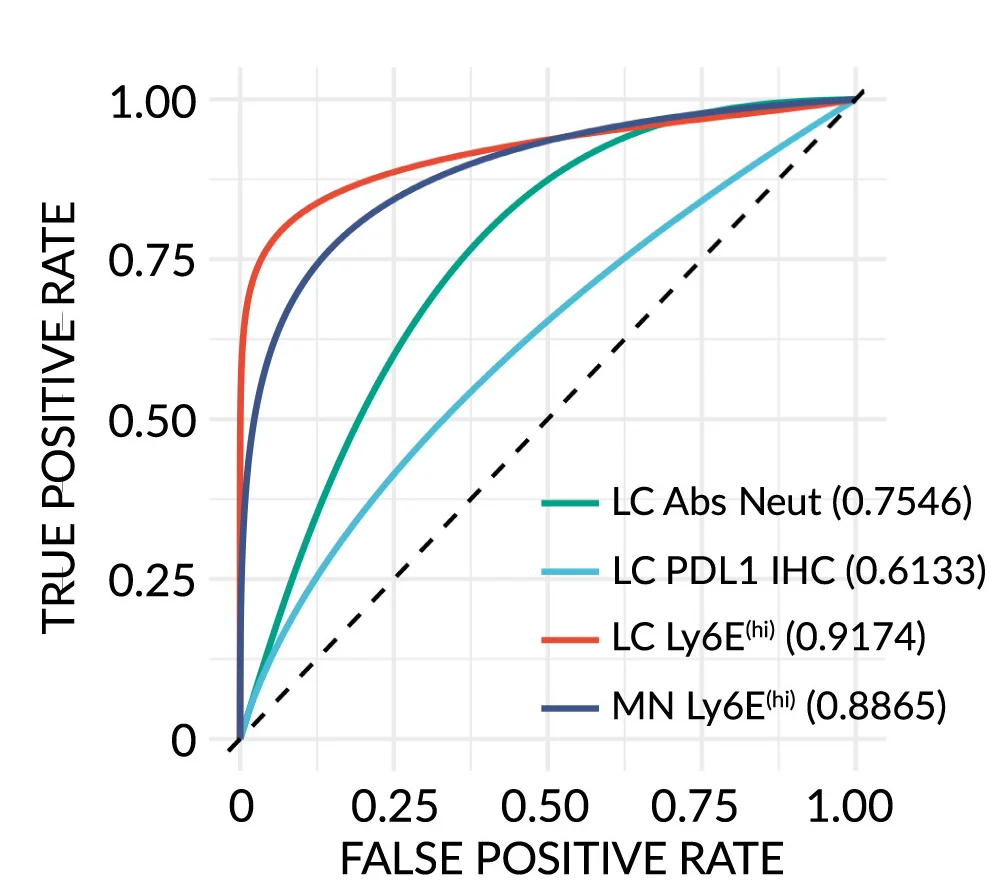
Interferon-stimulated neutrophil signature predictive accuracy for immunotherapy response - View full plot details
Immunotherapy research demonstrates advanced ROC curve implementation for biomarker validation. The Cancer Cell publication investigating interferon-stimulated neutrophils (DOI: 10.1016/j.ccell.2023.12.005) uses ROC curves to present predictive performance of neutrophil activation signatures for immunotherapy response across different cancer types and treatment protocols. The researchers effectively demonstrate biomarker clinical utility while providing validation necessary for precision immunotherapy implementation.
Maximizing Clinical Translation Impact
Based on my extensive experience implementing ROC analyses across diverse biomedical research contexts, several key principles consistently distinguish exceptional diagnostic discoveries from merely adequate performance assessments:
• Regulatory Compliance and Clinical Validation: The most effective ROC implementations incorporate regulatory guidelines, clinical validation requirements, and healthcare system integration considerations that facilitate translation of diagnostic discoveries into approved clinical applications and standard-of-care implementations. I consistently recommend validation approaches that align with FDA guidance documents, incorporate appropriate comparator methods, and include health economic evaluation that supports clinical adoption and reimbursement decisions.
• Patient Heterogeneity and Equity Considerations: Context-appropriate ROC analysis must account for patient population diversity, healthcare disparities, and demographic factors that influence diagnostic accuracy and clinical implementation across different patient subgroups and healthcare settings. In my collaborative clinical research, I emphasize validation strategies that include diverse patient populations while accounting for social determinants of health and healthcare access considerations that influence diagnostic implementation equity and clinical effectiveness.
• Real-World Evidence and Implementation Science: Future-oriented ROC analysis will increasingly incorporate real-world evidence, implementation science frameworks, and clinical workflow integration that bridge the gap between research validation and clinical practice implementation through comprehensive performance assessment and deployment strategies. However, the fundamental principles of rigorous statistical validation, clinical relevance assessment, and regulatory compliance will continue to determine the difference between research achievements and clinically impactful diagnostic innovations.
Advancing Your Diagnostic Algorithm Development Skills
The ROC curve examples featured in our curated collection represent the highest standards of diagnostic performance assessment, drawn from publications in Nature Medicine, Cell, Cancer Cell, and other leading medical journals. Each example demonstrates effective integration of statistical rigor with clinical relevance while advancing our understanding of diagnostic accuracy and predictive modeling through sophisticated performance evaluation approaches.
My analysis of thousands of ROC implementations across diverse biomedical research contexts has reinforced their critical importance for diagnostic development and clinical decision support that drives evidence-based medicine and precision healthcare delivery. When implemented thoughtfully with attention to statistical accuracy, clinical context, and regulatory requirements, ROC curves transform predictive models into clinically validated diagnostic tools that advance patient care and clinical outcomes.
I encourage biomedical researchers to explore our complete curated collection of ROC curve examples, where you can discover additional high-quality performance analyses from cutting-edge clinical research across multiple medical specialties and diagnostic applications. Each plot includes comprehensive validation methodology documentation and clinical implementation guidance, enabling you to adapt proven diagnostic development approaches to your own clinical research challenges and regulatory submission objectives.
Want to explore more examples of professional ROC curve implementation from top-tier medical publications? Check out our curated collection at: ROC Curve - featuring dozens of publication-quality diagnostic performance analyses from Nature Medicine, Cell, Cancer Cell, and other leading medical journals, each with complete validation methodology details and regulatory compliance examples.
Related Articles
Genomic Data Integration: Circos Plots in Circular Genome Visualization and Multi-Omics Analysis
Master Circos plot creation for genomic data integration and circular visualization through real examples from Nature Genetics, Cell, and leading journals. Learn genome-wide patterns, structural variation, and multi-omics integration.

Evolutionary Relationship Visualization: Phylogenetic Trees in Species Analysis and Genomic Evolution
Master phylogenetic tree creation for evolutionary analysis and species relationships through real examples from Nature, Science, and leading journals. Learn tree topology, branch lengths, and evolutionary inference.
Distribution Comparison Excellence: Ridgeline Plots in Density Analysis and Group Comparison
Master ridgeline plot creation for distribution comparison and density visualization through real examples from Nature, Cell, and leading journals. Learn multi-group distributions, density curves, and comparative analysis.