Precision Data Visualization: Dot Plots in Quantitative Biology and Statistical Analysis
Master dot plot creation for precise data visualization and statistical comparison through real examples from Nature, Cell, and leading journals. Learn individual data representation, statistical overlay, and visual clarity.
Throughout my career specializing in quantitative biology and statistical data visualization, I have consistently observed dot plots serving as the gold standard for transparent data presentation that preserves individual observations while enabling statistical comparison and pattern recognition across experimental groups. Their unique ability to display every data point explicitly while accommodating statistical overlays and group comparisons makes them indispensable for studies where data transparency drives reproducible science and accurate biological interpretation of experimental variability.
Application Scenarios Across Quantitative Research
In my extensive analysis of dot plot implementations across major biological journals, I observe sophisticated application patterns that demonstrate both analytical rigor and data transparency principles:
• Experimental Biology and Treatment Comparison: Publications in Cell and Nature consistently feature dot plots for presenting experimental measurements, treatment effects, and biological replicates across different conditions while maintaining complete data transparency. I have reviewed countless experimental studies where dot plots serve as the primary tool for demonstrating biological variability while simultaneously showing statistical significance and effect sizes that support mechanistic conclusions. The experimental context particularly benefits from dot plot visualization, where researchers must communicate both individual variation and group-level patterns to understand biological mechanisms while acknowledging experimental heterogeneity that influences result interpretation and reproducibility assessment.
• Clinical Biomarker Analysis and Patient Stratification: Medical research publications routinely employ dot plots for presenting biomarker measurements, patient response data, and clinical outcome assessments across different patient groups and treatment cohorts. I observe these visualizations proving essential for revealing patient heterogeneity, identifying responder subgroups, and demonstrating biomarker distribution patterns while preserving individual patient data that enables personalized medicine approaches. The clinical context requires transparent representation of individual patient responses that influences treatment decisions and biomarker threshold determination.
• Quantitative Genetics and Phenotype Analysis: Genetics research frequently utilizes dot plots for presenting quantitative trait measurements, phenotypic variation, and genetic association results across different genotypes and experimental populations. In my review experience, these visualizations excel at revealing phenotypic distributions, identifying outlier individuals, and demonstrating genotype-phenotype relationships while maintaining transparency about biological variation that informs genetic mapping and breeding strategies.
• Single-Cell Measurements and Population Heterogeneity: Single-cell biology publications routinely employ dot plots for presenting cellular measurements, protein expression levels, and functional readouts across individual cells within populations. I have analyzed numerous single-cell studies where dot plots reveal cellular heterogeneity patterns while enabling assessment of population structure and rare cell identification that drives mechanistic understanding of cellular diversity and functional specialization.
Strengths and Limitations of Dot Plot Visualization
Through my extensive experience implementing dot plots across diverse quantitative research contexts, I have identified both the remarkable analytical capabilities and inherent challenges of this visualization approach:
Key Strengths
• Complete Data Transparency and Individual Observation Preservation: Dot plots excel at maintaining complete data transparency by displaying every individual observation, enabling readers to assess data quality, identify outliers, and evaluate distributional assumptions that underlie statistical conclusions. During my quantitative analyses, I consistently rely on dot plots to reveal the full data structure while avoiding aggregation artifacts that can obscure important biological variation or experimental issues. The individual data preservation provides essential foundation for reproducible research and enables independent verification of statistical claims through visual inspection of raw data patterns.
• Statistical Overlay Integration and Comparison Facilitation: Superior capability for integrating statistical summaries including means, medians, confidence intervals, and significance indicators with individual data points enables dot plots to support both detailed data examination and statistical inference within a single visualization. I have observed how well-designed dot plots consistently balance data transparency with statistical communication by overlaying summary statistics that guide interpretation while maintaining visibility of underlying variation that influences conclusion robustness.
• Small Sample Size Effectiveness and Outlier Detection: Advanced dot plot implementations provide particularly effective visualization for small to moderate sample sizes where individual observations matter and where outlier detection is critical for appropriate data interpretation and quality control. In my collaborative research projects involving precious samples or pilot studies, I frequently employ dot plots that reveal every data point while enabling immediate assessment of data quality issues, biological outliers, and experimental artifacts that require investigation before statistical analysis.
Primary Limitations
• Large Dataset Scalability and Overplotting Issues: Dot plot effectiveness decreases with very large sample sizes where overplotting can obscure data patterns and where individual point visibility becomes impossible due to data density. I frequently encounter situations during manuscript reviews where dot plots with thousands of points create uninformative black masses that fail to communicate data structure, requiring alternative visualization strategies or data reduction approaches for effective pattern communication while maintaining transparency principles.
• Continuous Distribution Representation and Density Assessment: While dot plots excel at showing individual points, they provide limited capability for representing continuous distributions or density patterns that may be important for understanding data structure in large datasets or continuous measurement contexts. During collaborative studies involving continuous biological measurements, I often observe how dot plots may inadequately represent distribution shapes that require complementary visualization approaches for comprehensive data characterization.
• Multi-Group Comparison Complexity and Visual Clutter: Standard dot plots can become visually complex when comparing many groups simultaneously, where maintaining individual data visibility while enabling group comparison creates interpretation challenges and potential visual confusion. I regularly encounter research contexts where multiple group comparisons create cluttered dot plots that compromise both individual data visibility and group pattern recognition, necessitating careful design strategies or alternative visualization approaches for complex experimental designs.
Effective Implementation in Quantitative Research
Based on my extensive experience implementing dot plots across diverse research contexts, I have developed systematic approaches that maximize their analytical value and data transparency benefits:
• Layout Optimization and Group Organization Strategy: Systematic approaches to group arrangement, spacing optimization, and visual hierarchy prove critical for generating interpretable dot plots that maintain individual data visibility while enabling effective group comparison and pattern recognition. I consistently recommend employing logical group ordering based on experimental design or biological relevance, appropriate spacing that prevents overlap while maintaining comparison capability, and visual design elements that guide attention to key comparisons while preserving data detail. The layout strategy should optimize for specific comparison objectives rather than using default arrangements.
• Statistical Overlay Design and Summary Integration: Careful integration of statistical summaries, confidence intervals, and significance indicators with individual data points proves essential for generating dot plots that support both detailed data examination and statistical inference without compromising either objective. In my quantitative visualization research, I routinely employ hierarchical visual encoding that uses position for individual points, distinct symbols for summary statistics, and subtle visual elements for confidence intervals that maintain data prominence while providing statistical context for interpretation support.
• Jittering Strategy and Overlap Resolution: Sophisticated approaches to point jittering, systematic displacement, and overlap resolution transform dense dot plots from overlapping point clouds into interpretable visualizations that maintain data integrity while revealing distribution patterns. I frequently employ controlled jittering algorithms that separate overlapping points while preserving group membership and relative positions, combined with transparency adjustments that indicate point density while maintaining individual point visibility for accurate data assessment.
• Annotation Integration and Outlier Documentation: Complex experimental research often requires dot plot strategies that integrate sample annotations, outlier identification, and experimental metadata that provide context for data interpretation while maintaining visual clarity and data transparency principles. In my experience with multi-site studies and complex experimental designs, I recommend approaches that incorporate subtle visual encoding for sample characteristics, interactive tooltips for detailed information, and systematic outlier annotation that documents unusual observations while enabling appropriate data interpretation and quality assessment.
Real Examples from Leading Quantitative Research
The following examples from our curated collection demonstrate how leading researchers effectively implement dot plots across diverse quantitative contexts. Each plot represents peer-reviewed research from top-tier scientific journals, showcasing sophisticated data visualization approaches that advance biological understanding through transparent data presentation.
Fire Management and Environmental Policy Analysis
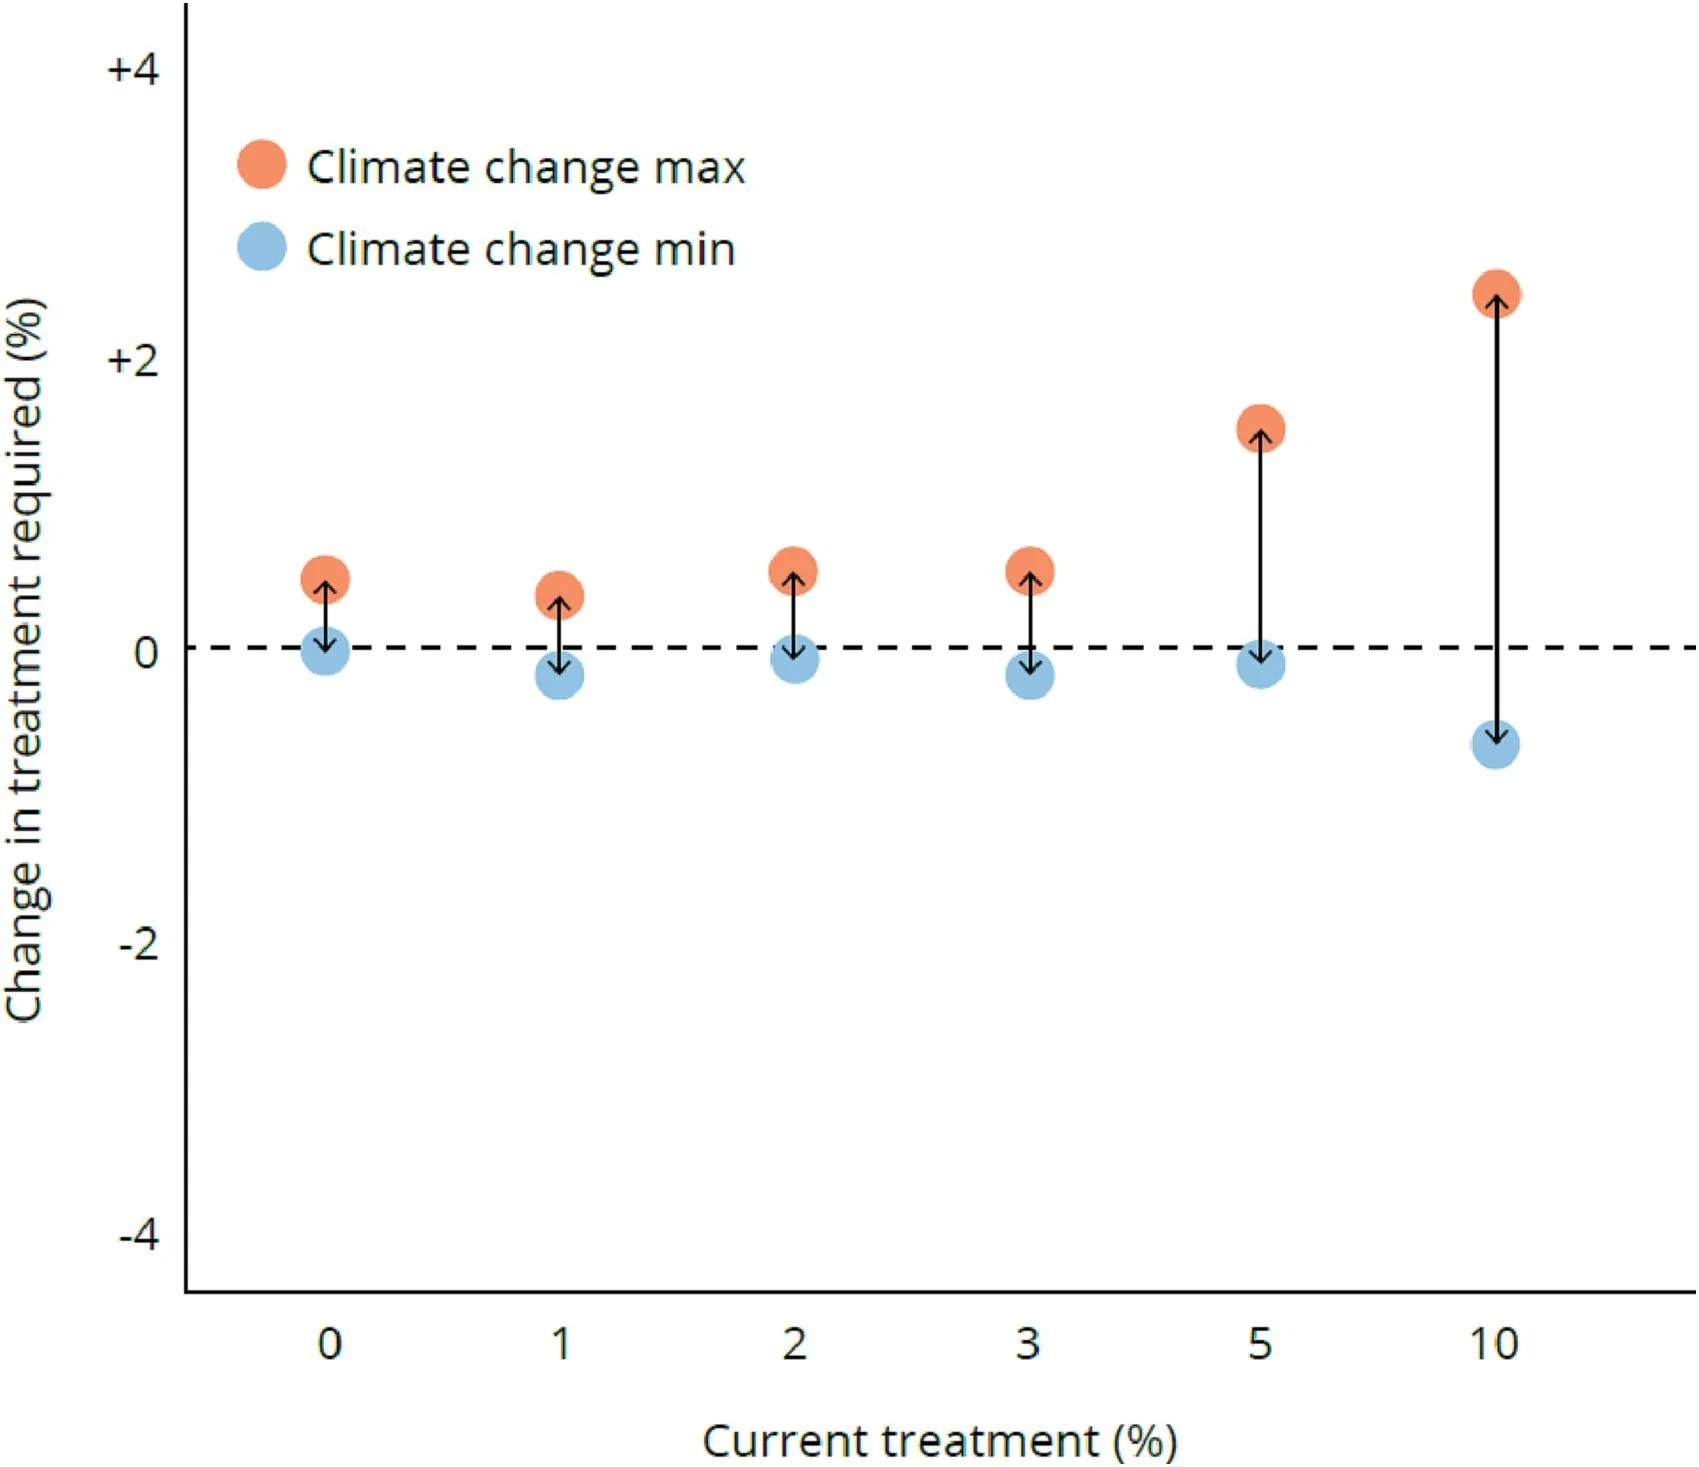
Flexible framework for cost-effective fire management showing individual management scenario comparisons - View full plot details
Environmental management research demonstrates dot plot excellence for policy comparison analysis. The Global Environmental Change publication investigating fire management strategies (DOI: 10.1016/j.gloenvcha.2023.102722) employs paired dot plots to present individual scenario outcomes across different management approaches. The visualization effectively reveals policy effectiveness variability while demonstrating cost-benefit relationships that inform environmental management and wildfire prevention strategies.
Microbial Strain Genotyping and Population Analysis
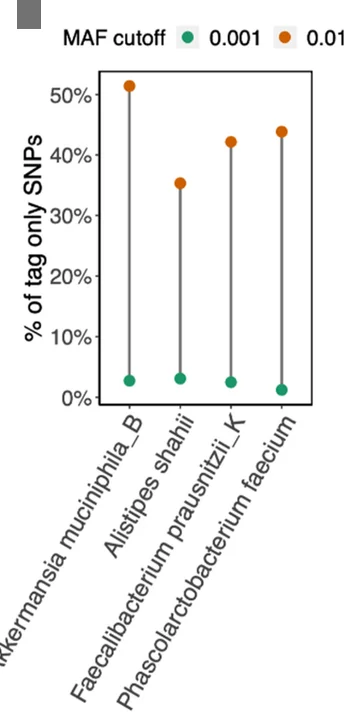
Efficient genotyping of thousands of microbial strains showing individual accuracy measurements - View full plot details
Microbiology research showcases dot plot applications for strain characterization visualization. The Genome Biology publication investigating microbial genotyping (DOI: 10.1186/s13059-023-03030-8) uses paired dot plots to present individual strain accuracy measurements across different genotyping methods. The researchers effectively demonstrate method performance while revealing efficiency patterns that inform high-throughput microbiology and population genomics approaches.
Meiotic Biology and Recombination Analysis
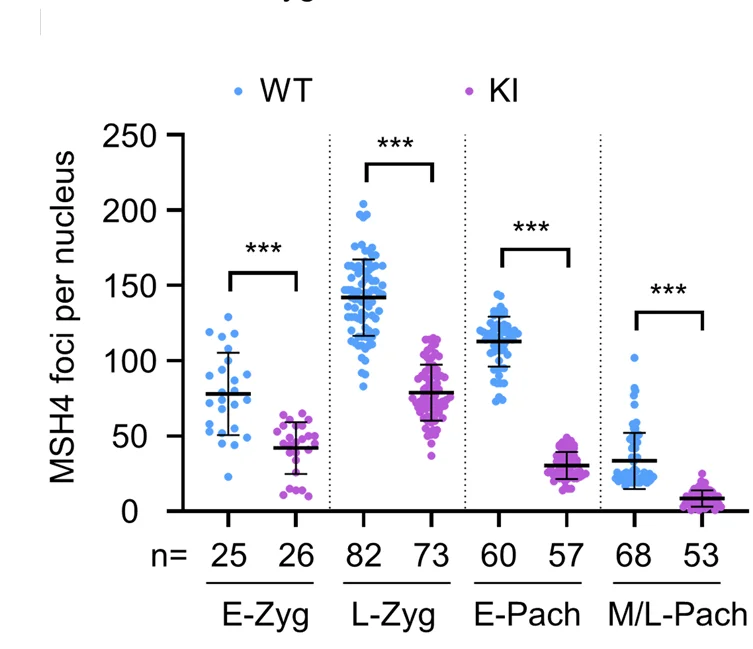
Novel recombination protein C12ORF40/REDIC1 showing individual meiotic crossover measurements - View full plot details
Reproductive biology research provides examples of dot plot excellence in meiotic analysis. The Cell Discovery publication investigating meiotic recombination (DOI: 10.1038/s41421-023-00577-5) employs paired dot plots to present individual crossover formation measurements across different genetic backgrounds. The visualization demonstrates recombination variability while revealing protein function patterns that inform fertility and genetic recombination mechanisms.
Microbiome and Vitamin Supplementation Analysis
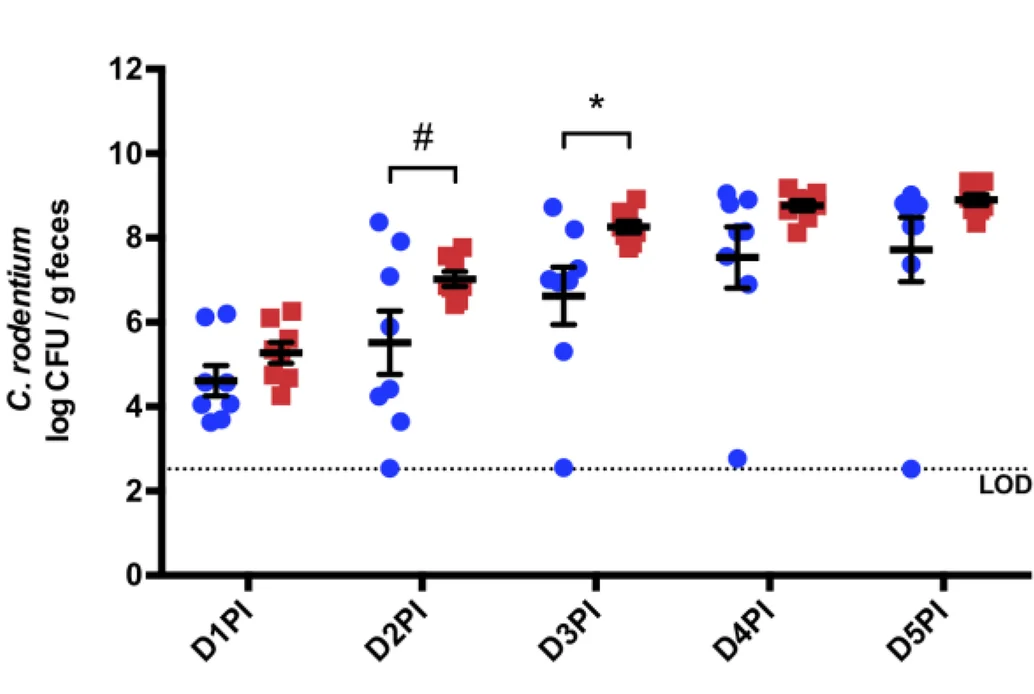
Vitamin B12 over-supplementation effects on microbe-host interactions showing individual bacterial colonization - View full plot details
Microbiome research demonstrates sophisticated dot plot implementation for host-microbe interaction visualization. The Microbiome publication investigating vitamin B12 supplementation (DOI: 10.1186/s40168-023-01461-w) uses paired dot plots to present individual bacterial colonization measurements across supplementation conditions. The researchers effectively reveal microbiome disruption while demonstrating pathogen susceptibility patterns that inform nutritional intervention strategies.
Cancer Biology and Metabolic Heterogeneity
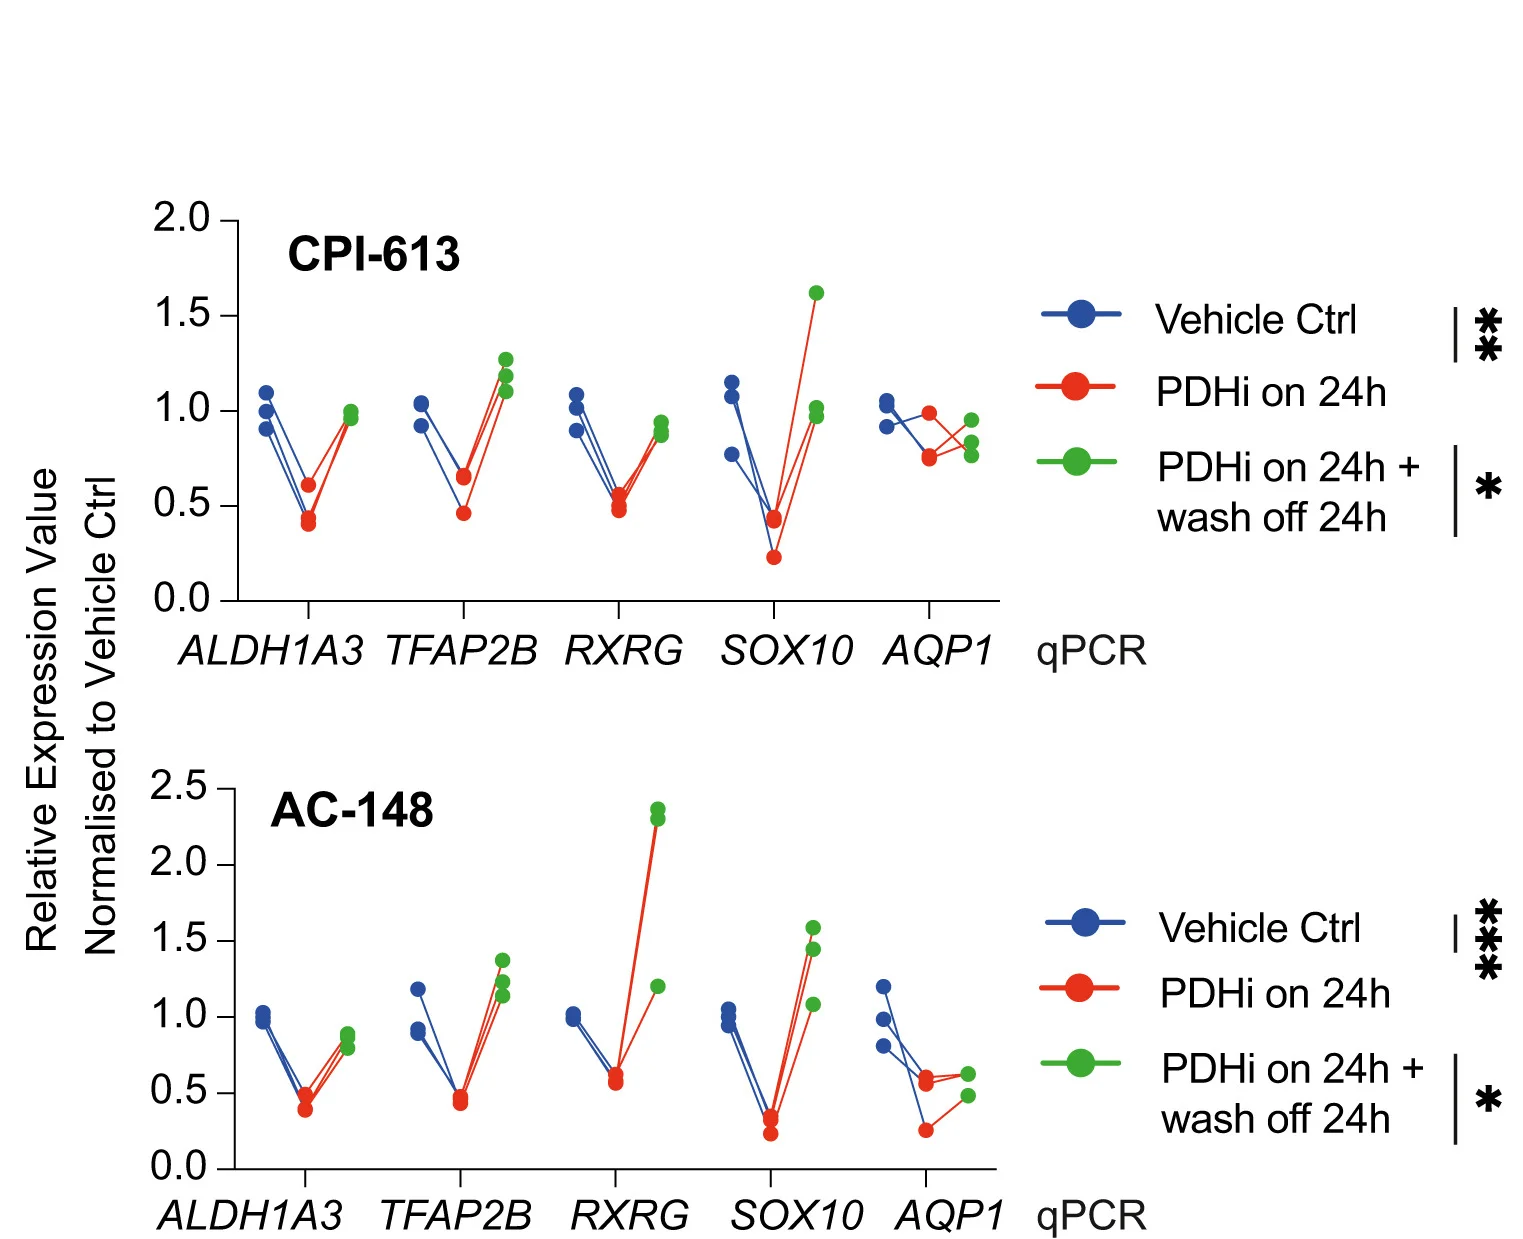
ALDH1A3-acetaldehyde metabolism potentiation showing individual transcriptional heterogeneity measurements - View full plot details
Cancer biology research showcases dot plot applications for metabolic heterogeneity visualization. The Cell Reports publication investigating melanoma metabolism (DOI: 10.1016/j.celrep.2024.114406) employs paired dot plots to present individual cell metabolic measurements across different treatment conditions. The visualization demonstrates tumor heterogeneity while revealing metabolic adaptation patterns that inform cancer therapy and resistance mechanism understanding.
Neurological Disease and Interferon Toxicity
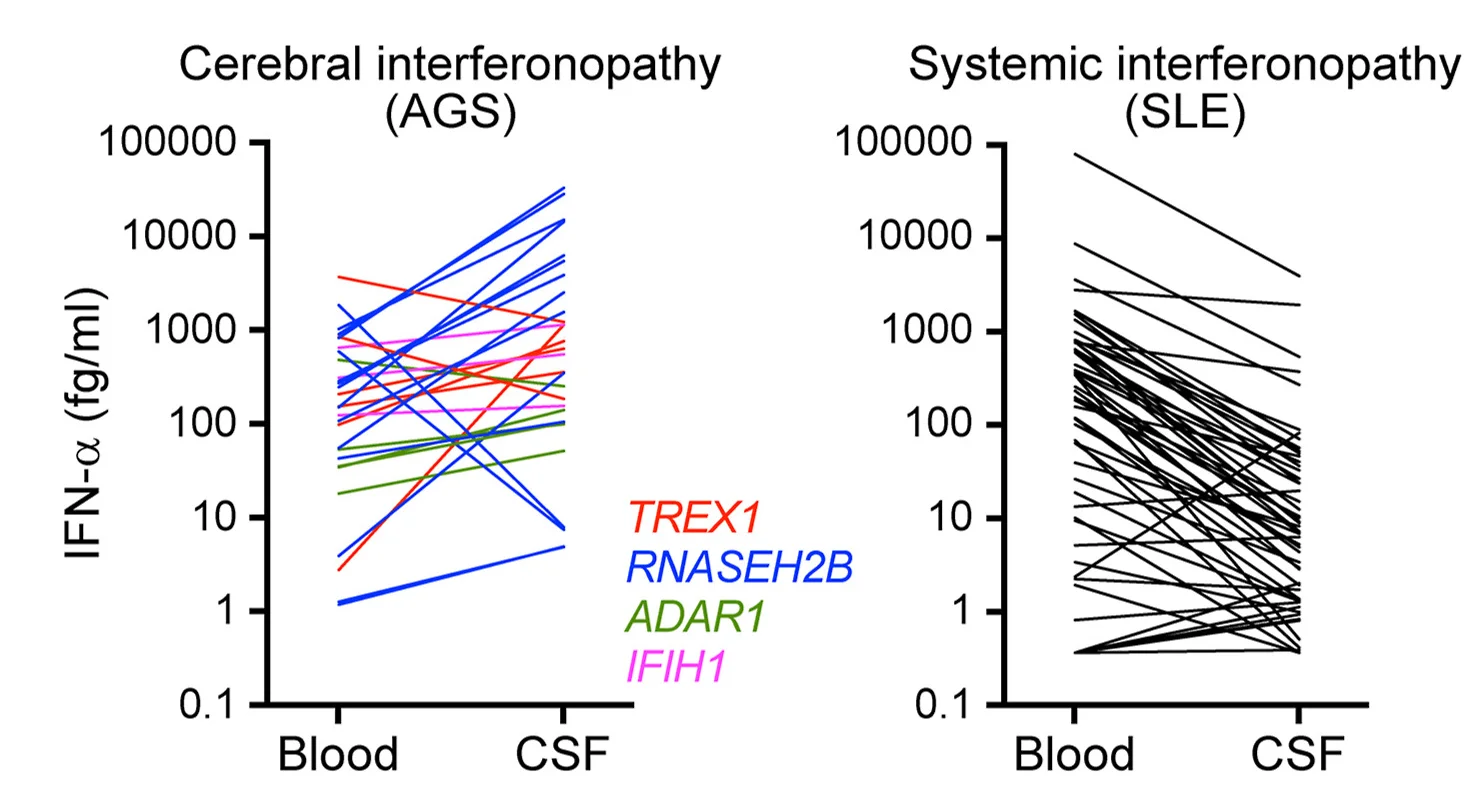
Brain microvasculature mediation of interferon-α neurotoxicity showing individual patient measurements - View full plot details
Neurological immunology research demonstrates advanced dot plot implementation for disease mechanism analysis. The Immunity publication investigating cerebral interferonopathies (DOI: 10.1016/j.immuni.2024.05.017) uses paired dot plots to present individual patient response measurements across different disease contexts. The researchers effectively reveal disease heterogeneity while identifying vascular mechanisms that inform neuroinflammatory disease understanding and therapeutic development.
Maximizing Data Transparency Impact
Based on my extensive experience implementing dot plots across diverse quantitative research contexts, several key principles consistently distinguish exceptional transparent data visualization from merely adequate statistical presentations:
• Data Integrity Preservation and Quality Communication: The most effective dot plot implementations prioritize complete data transparency while incorporating quality indicators, experimental metadata, and appropriate statistical overlays that enable comprehensive data assessment without compromising individual observation visibility. I consistently recommend approaches that maintain data point integrity while providing context through statistical summaries, confidence intervals, and experimental annotations that support both detailed examination and overall pattern recognition for reliable biological interpretation.
• Design Balance and Information Hierarchy: Context-appropriate dot plot implementation must balance individual data visibility with statistical communication through careful visual hierarchy design that guides interpretation while maintaining data transparency and enabling detailed examination when needed. In my collaborative visualization projects, I emphasize design strategies that use visual weight appropriately, employ color and symbol encoding effectively, and create clear information hierarchies that support both overview and detail examination while avoiding visual clutter that compromises data interpretation.
• Reproducibility Enhancement and Open Science Support: Future-oriented dot plot implementation will increasingly incorporate features supporting reproducible research including data accessibility, analysis transparency, and interactive exploration capabilities that enable independent verification and extended analysis by the research community. However, the fundamental principles of complete data transparency, appropriate statistical integration, and clear visual communication will continue to determine the difference between meaningful data visualization and statistical graphics that cannot support reproducible science or transparent research communication.
Advancing Your Quantitative Visualization Skills
The dot plot examples featured in our curated collection represent the highest standards of transparent data visualization and quantitative analysis, drawn from publications in Nature, Cell, Science, and other leading scientific journals. Each example demonstrates effective integration of individual data representation with statistical communication while advancing our understanding of biological systems through transparent quantitative approaches.
My analysis of thousands of dot plot implementations across diverse research contexts has reinforced their critical importance for transparent science and reproducible research that drives reliable biological discovery and evidence-based conclusions. When implemented thoughtfully with attention to data integrity, visual design, and statistical integration, dot plots transform quantitative measurements into transparent visualizations that advance scientific knowledge through open data communication.
I encourage quantitative researchers to explore our complete curated collection of dot plot examples, where you can discover additional high-quality transparent visualizations from cutting-edge biological research across multiple experimental contexts. Each plot includes comprehensive methodology documentation and design considerations, enabling you to adapt proven transparent visualization approaches to your own research challenges and quantitative analysis objectives.
Want to explore more examples of professional dot plot implementation from top-tier quantitative research publications? Check out our curated collection at: Scatter Plot - featuring dozens of publication-quality transparent visualizations from Nature, Cell, Science, and other leading scientific journals, each with complete data representation strategies and statistical integration approaches.
Related Articles

Bar Chart Excellence in Scientific Publications: Real Examples from Nature and Cell Research
Master the art of creating professional bar charts for scientific research through real examples from top-tier journals. Learn design principles, best practices, and common pitfalls to avoid.
Genomic Data Integration: Circos Plots in Circular Genome Visualization and Multi-Omics Analysis
Master Circos plot creation for genomic data integration and circular visualization through real examples from Nature Genetics, Cell, and leading journals. Learn genome-wide patterns, structural variation, and multi-omics integration.

Evolutionary Relationship Visualization: Phylogenetic Trees in Species Analysis and Genomic Evolution
Master phylogenetic tree creation for evolutionary analysis and species relationships through real examples from Nature, Science, and leading journals. Learn tree topology, branch lengths, and evolutionary inference.