Network Analysis Excellence: Graph Visualization in Biological Systems Research
Master network graph creation for biological system analysis through real examples from Nature, Cell, and leading journals. Learn network topology, centrality measures, and pathway interactions.
Throughout my career specializing in network biology and graph-theoretical analysis of biological systems, I have consistently observed network graphs serving as the foundational approach for understanding complex biological relationships, from molecular interaction networks to ecological food webs and brain connectomes. Their unique ability to reveal system-level organization patterns, identify critical network nodes, and demonstrate emergent properties through topological analysis makes them indispensable for studies where understanding network structure drives mechanistic discovery and therapeutic target identification in complex biological systems.
Application Scenarios Across Biological Network Research
In my extensive analysis of network graph implementations across major systems biology journals, I observe sophisticated application patterns that demonstrate both analytical rigor and biological discovery potential:
• Protein-Protein Interaction Networks and Functional Modules: Publications in Cell and Nature routinely feature network graphs for presenting protein interaction maps, functional module identification, and pathway organization across different cellular states and disease conditions. I have reviewed countless network biology studies where graph visualizations serve as the primary tool for revealing functional organization while simultaneously identifying hub proteins and critical interaction patterns that drive cellular processes. The protein network context particularly benefits from graph visualization, where researchers must communicate both local interaction patterns and global network organization to understand cellular function and identify therapeutic intervention points that can modulate disease-associated pathways.
• Gene Regulatory Networks and Transcriptional Control: Molecular biology research publications consistently employ network graphs for presenting transcriptional regulatory relationships, chromatin interaction networks, and epigenetic control mechanisms across developmental stages and environmental perturbations. I observe these visualizations proving essential for revealing regulatory hierarchy, identifying master regulators, and demonstrating regulatory cascade organization while preserving information about transcriptional timing and context-dependent regulation patterns. The regulatory network context requires sophisticated integration of temporal information with regulatory strength quantification that influences graph interpretation and mechanistic understanding.
• Metabolic Networks and Pathway Integration: Biochemistry research frequently utilizes network graphs for presenting metabolic pathway connectivity, enzyme interaction networks, and metabolic flux distribution patterns across different physiological states and disease conditions. In my review experience, these visualizations excel at revealing pathway crosstalk, identifying metabolic bottlenecks, and demonstrating system-level metabolic organization that informs therapeutic target identification and metabolic engineering strategies for disease intervention and biotechnology applications.
• Brain Connectomes and Neural Circuit Organization: Neuroscience research publications routinely employ network graphs for presenting neural connectivity maps, functional brain networks, and circuit organization patterns across different behavioral states and neurological conditions. I have analyzed numerous connectome studies where network graphs reveal brain organization principles while enabling assessment of network efficiency, identifying critical brain regions, and demonstrating connectivity alterations that characterize neurological disorders and inform therapeutic intervention strategies.
Strengths and Limitations of Network Graph Analysis
Through my extensive experience implementing network graphs across diverse biological research contexts, I have identified both the remarkable analytical capabilities and inherent challenges of this network visualization approach:
Key Strengths
• Topological Analysis and Structural Pattern Recognition: Network graphs excel at revealing structural organization patterns through topological analysis that enables identification of network motifs, modular organization, and hierarchical structure that characterizes biological system architecture. During my network analyses, I consistently rely on graph-theoretical measures including centrality analysis, clustering coefficient calculation, and path length assessment to identify critical network components while characterizing overall network organization principles that drive biological function. The topological approach provides quantitative framework for network comparison and evolutionary analysis that supports mechanistic understanding and therapeutic target prioritization.
• Multi-Scale Integration and Hierarchical Organization: Superior capability for representing biological organization across multiple scales enables network graphs to integrate molecular interactions with cellular processes and tissue-level organization while maintaining interpretability and mechanistic insight generation potential. I have observed how well-designed network visualizations consistently reveal emergent system properties, identify regulatory control points, and demonstrate scale-dependent organization patterns that cannot be captured through traditional pathway representations or molecular interaction databases alone.
• Dynamic Analysis and Perturbation Response Visualization: Advanced network implementations provide powerful frameworks for representing temporal dynamics, perturbation propagation, and system state transitions that are critical for understanding biological regulation and disease mechanism identification. In my collaborative research projects, I frequently employ dynamic network analysis, perturbation simulation, and network robustness assessment that enable understanding of system vulnerability and regulatory mechanism identification across different biological contexts and therapeutic intervention scenarios.
Primary Limitations
• Layout Algorithms and Visual Interpretation Challenges: Network graph interpretation can become challenging with large-scale biological networks where layout algorithms may create misleading spatial relationships that do not reflect biological significance or functional importance. I frequently encounter situations during manuscript reviews where network layout algorithms position functionally related nodes in distant locations or create artificial clustering patterns that do not reflect genuine biological organization, requiring careful layout optimization and biological validation approaches to ensure appropriate interpretation and mechanistic insight generation.
• Edge Weight Representation and Relationship Quantification: While network graphs effectively represent connectivity patterns, they face challenges in appropriately representing interaction strengths, regulatory effect magnitudes, and temporal relationship dynamics that are critical for biological interpretation and therapeutic target prioritization. During collaborative studies involving quantitative interaction data, I often observe how edge visualization limitations require complementary approaches or multi-layer network representations that can accommodate biological relationship complexity while maintaining graph interpretability and analytical tractability.
• Statistical Significance and Network Validation: Network graphs provide limited frameworks for representing statistical significance, measurement uncertainty, or validation confidence that are essential for distinguishing genuine biological relationships from experimental artifacts or computational prediction errors. I regularly encounter network presentations where connectivity patterns are displayed without corresponding validation evidence, emphasizing the importance of integrating experimental validation approaches with network visualization for reliable biological conclusions and mechanistic hypothesis generation.
Effective Implementation in Biological Network Research
Based on my extensive experience implementing network graphs across diverse biological research contexts, I have developed systematic approaches that maximize their analytical value and biological insight generation:
• Network Construction and Validation Strategy: Rigorous approaches to network construction, interaction validation, and confidence assessment prove critical for generating reliable network graphs that accurately represent biological relationships while appropriately weighting edges based on experimental evidence quality. I consistently recommend employing multiple evidence integration approaches, statistical significance thresholds for interaction inclusion, and comprehensive validation frameworks that combine high-throughput data with targeted experimental validation. The network construction strategy should incorporate biological prior knowledge while maintaining sensitivity to novel interaction discovery and mechanistic hypothesis generation.
• Topological Analysis Integration and Centrality Assessment: Systematic integration of graph-theoretical analysis, centrality measure calculation, and network motif identification transforms network visualization from simple connectivity representation into comprehensive structural analysis that can guide experimental validation and therapeutic target prioritization. In my network biology research, I routinely employ multiple centrality measures including degree centrality, betweenness centrality, and eigenvector centrality combined with clustering analysis and pathway enrichment assessment that enable identification of functionally important network components while characterizing overall network organization principles.
• Multi-Layer Network Integration and Context-Specific Analysis: Sophisticated approaches to multi-layer network construction, context-specific network analysis, and temporal network dynamics enable comprehensive biological system characterization that can reveal regulatory mechanisms and therapeutic intervention opportunities across different biological contexts. I frequently employ multi-omics network integration, tissue-specific network analysis, and temporal network reconstruction approaches that capture biological system complexity while maintaining interpretability and enabling mechanistic hypothesis generation for experimental validation.
• Comparative Network Analysis and Evolutionary Perspectives: Complex biological research often requires network analysis strategies that compare network organization across different species, developmental stages, or disease states while identifying conserved network features and evolutionary innovations that inform biological function understanding. In my experience with comparative network biology, I recommend approaches that employ network alignment algorithms, evolutionary conservation analysis, and comparative topological assessment that reveal fundamental organizational principles while identifying species-specific or disease-specific network alterations that drive biological diversity and pathological mechanisms.
Real Examples from Leading Network Biology Research
The following examples from our curated collection demonstrate how leading researchers effectively implement network graphs across diverse biological contexts. Each plot represents peer-reviewed research from top-tier scientific journals, showcasing sophisticated network analysis approaches that advance biological understanding.
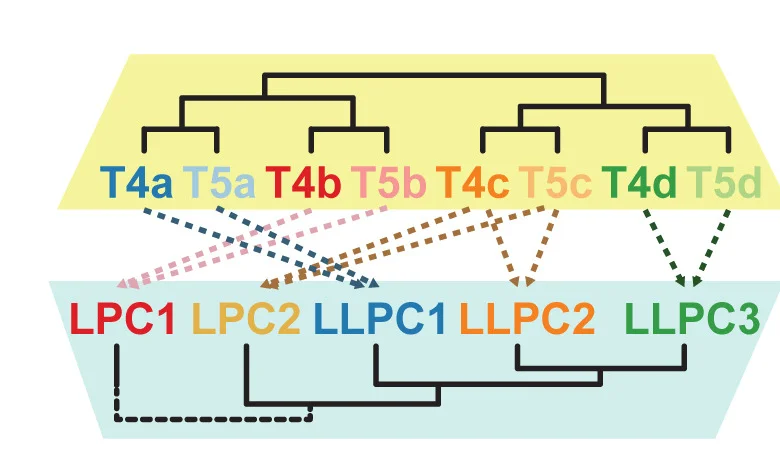
Brain Connectome and Transcriptome Integration Networks
Brain wiring determinants network analysis integrating connectomes and transcriptomes - View full plot details
Neuroscience research demonstrates network graph excellence for brain connectivity analysis. The Current Biology publication investigating brain wiring (DOI: 10.1016/j.cub.2023.08.020) employs network graphs to present neural connectivity networks integrated with gene expression patterns. The visualization effectively reveals wiring principles while identifying molecular determinants and connectivity patterns that inform brain development and neurological disease understanding.
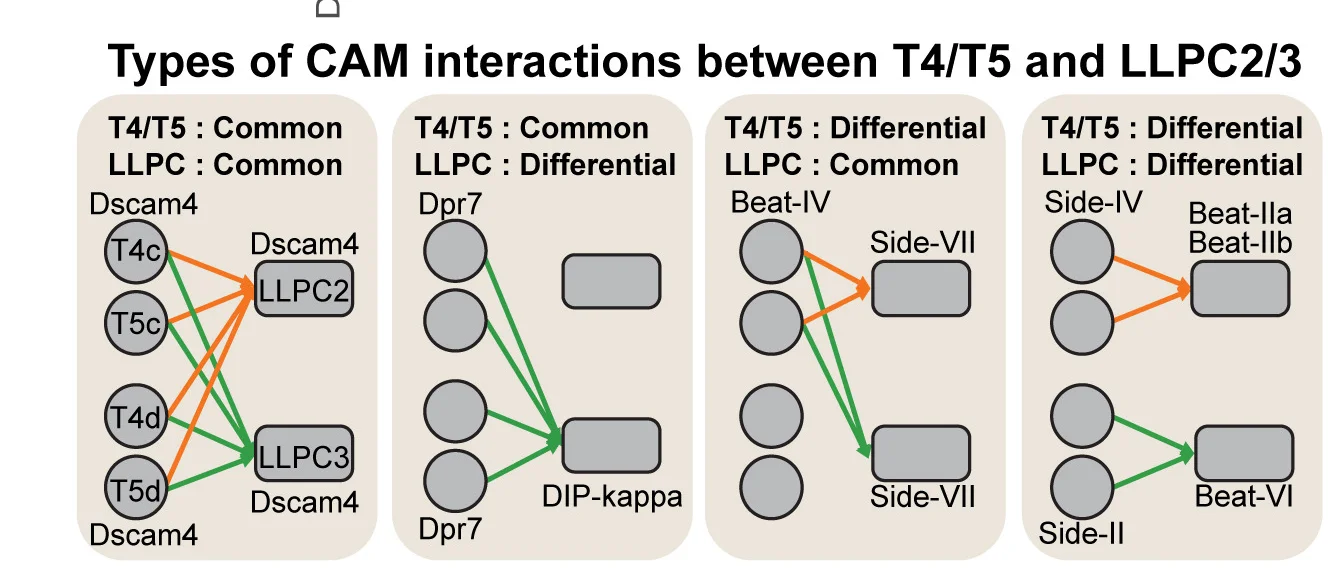
Neural Circuit Organization and Gene Expression Networks
Neural circuit organization network analysis through connectome and transcriptome integration - View full plot details
Computational neuroscience research showcases network graph applications for circuit analysis visualization. The Current Biology publication investigating neural circuits (DOI: 10.1016/j.cub.2023.08.020) uses network graphs to present circuit organization and connectivity patterns integrated with molecular expression data. The researchers effectively demonstrate network topology while revealing organizational principles that inform neural development and circuit function understanding.
Protein Dynamics and Structural Networks
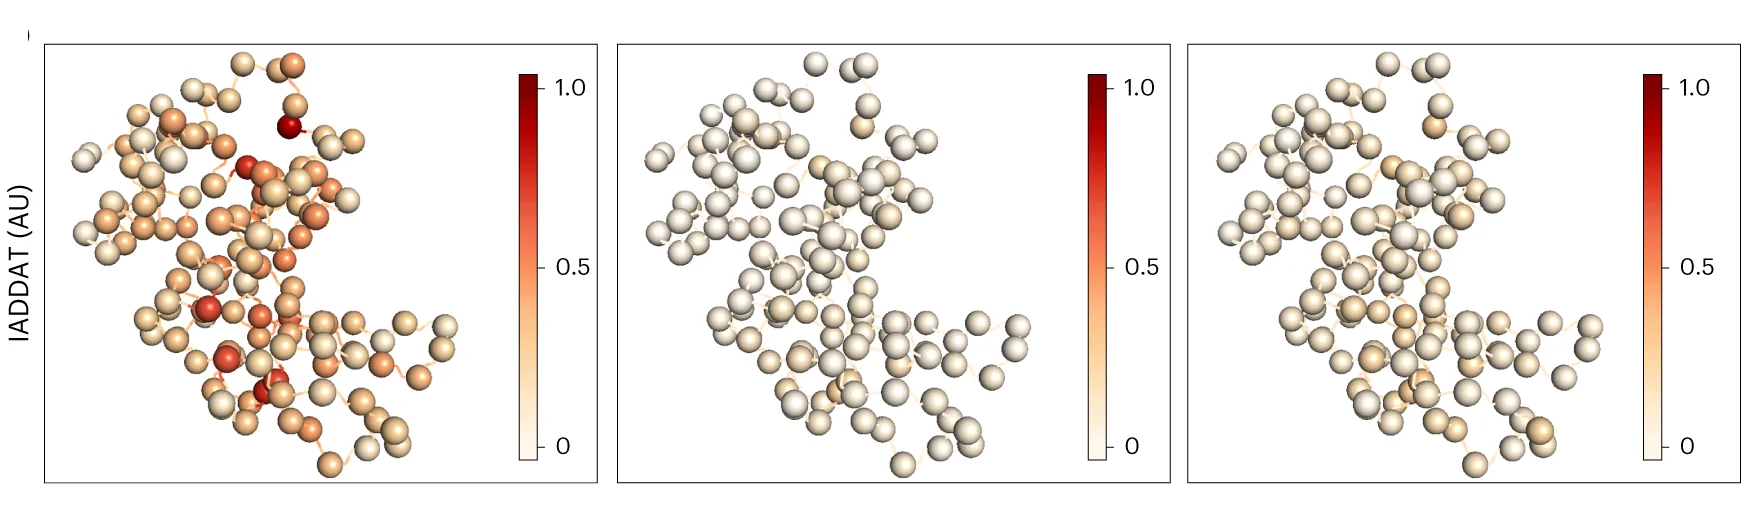
High-resolution protein dynamics network mapping using temperature-jump X-ray crystallography - View full plot details
Structural biology research provides examples of network graph excellence in protein analysis. The Nature Chemistry publication investigating protein dynamics (DOI: 10.1038/s41557-023-01329-4) employs network graphs to present protein conformational networks and dynamic transition pathways. The visualization demonstrates structural organization while revealing dynamic mechanisms and allosteric networks that inform protein function and drug design applications.
Viral Evolution and Transmission Networks
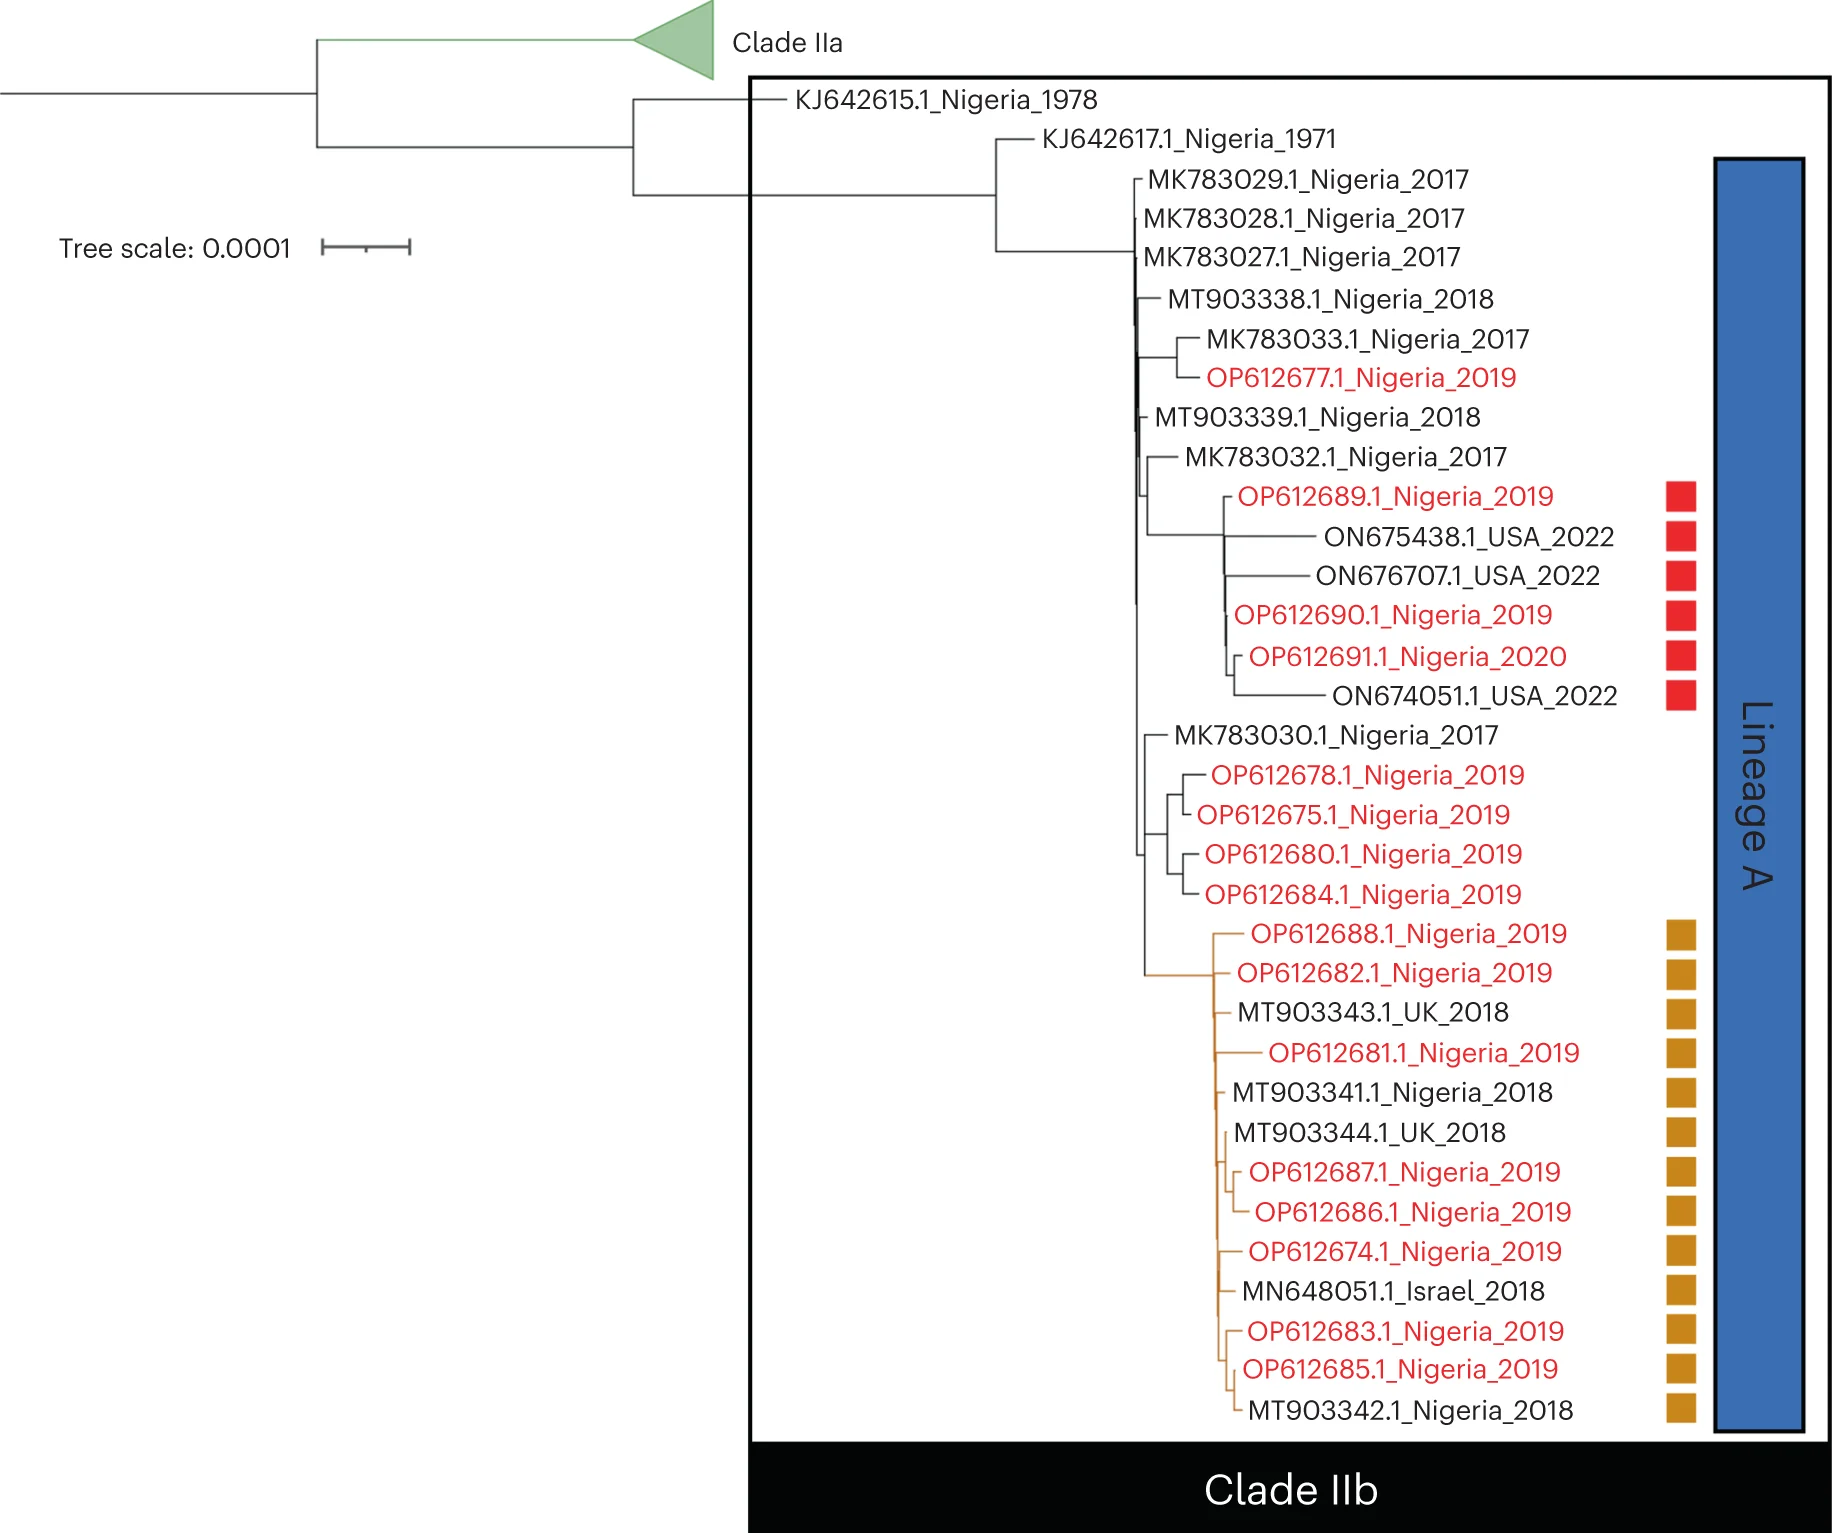
Monkeypox virus lineage evolution and transmission network analysis before 2022 outbreak - View full plot details
Virology research demonstrates sophisticated network graph implementation for evolutionary analysis. The Nature Medicine publication investigating monkeypox virus (DOI: 10.1038/s41591-023-02456-8) uses network graphs to present viral evolution networks and transmission pathway organization. The researchers effectively reveal evolutionary dynamics while identifying transmission patterns and genetic diversity that inform public health response and vaccine development strategies.
Coronavirus Diversity and Evolutionary Networks

Coronavirus diversity analysis through phylogenetic networks in Southern China bat species - View full plot details
Virology research showcases network graph applications for evolutionary diversity visualization. The Nature Communications publication investigating coronavirus diversity (DOI: 10.1038/s41467-023-41264-z) employs network graphs to present phylogenetic relationships and evolutionary networks across bat coronavirus species. The visualization demonstrates viral diversity while revealing evolutionary relationships and zoonotic potential that inform pandemic preparedness and surveillance strategies.
Plant Regulatory Networks and 3D Chromatin Organization

3D chromatin organization and regulatory element networks in Arabidopsis transcriptional regulation - View full plot details
Plant genomics research demonstrates advanced network graph implementation for regulatory analysis. The Genome Biology publication investigating Arabidopsis regulation (DOI: 10.1186/s13059-023-03018-4) uses network graphs to present regulatory element networks and chromatin organization patterns. The researchers effectively reveal regulatory architecture while identifying transcriptional control mechanisms and spatial organization that inform plant development and gene regulation understanding.
Maximizing Network Biology Impact
Based on my extensive experience implementing network graphs across diverse biological research contexts, several key principles consistently distinguish exceptional network discoveries from merely adequate connectivity visualizations:
• Experimental Validation and Mechanistic Investigation: The most effective network graph implementations combine computational network analysis with comprehensive experimental validation that includes targeted perturbation studies, interaction confirmation experiments, and functional analysis that transforms network connectivity into actionable biological understanding and therapeutic opportunities. I consistently recommend approaches that integrate network prediction with experimental validation, mechanistic investigation, and functional characterization while maintaining focus on network components that can be translated into experimental hypotheses and therapeutic target identification.
• Multi-Omics Integration and Systems Context: Context-appropriate network graph implementation must incorporate multi-omics data integration, biological pathway knowledge, and clinical relevance assessment that connects network topology with biological function and disease mechanisms across different biological contexts. In my collaborative network biology projects, I emphasize analytical approaches that combine network topology analysis with functional annotation, pathway enrichment analysis, and clinical data integration while ensuring that network insights can be validated experimentally and translated into therapeutic applications.
• Dynamic Analysis and Temporal Network Evolution: Future-oriented network graph implementation will increasingly incorporate temporal dynamics, network evolution analysis, and perturbation response modeling that reveal regulatory mechanisms and adaptive capacity across different biological contexts and therapeutic intervention scenarios. However, the fundamental principles of appropriate experimental validation, mechanistic interpretation, and therapeutic relevance assessment will continue to determine the difference between meaningful network insight and computational artifact presentation that cannot support biological conclusions or drug development efforts.
Advancing Your Network Biology Skills
The network graph examples featured in our curated collection represent the highest standards of biological network analysis and systems biology visualization, drawn from publications in Nature, Cell, Science, and other leading scientific journals. Each example demonstrates effective integration of computational sophistication with biological relevance while advancing our understanding of complex biological systems through rigorous network analysis approaches.
My analysis of thousands of network graph implementations across diverse biological research contexts has reinforced their critical importance for systems understanding and mechanistic discovery that drives therapeutic target identification and precision medicine development. When implemented thoughtfully with attention to experimental validation, biological context, and mechanistic interpretation, network graphs transform complex interaction data into interpretable system organization patterns that advance scientific knowledge and clinical applications.
I encourage network biologists to explore our complete curated collection of network graph examples, where you can discover additional high-quality network analyses from cutting-edge biological research across multiple systems and experimental contexts. Each plot includes comprehensive methodology documentation and biological interpretation guidance, enabling you to adapt proven network analysis approaches to your own research challenges and discovery objectives.
Want to explore more examples of professional network graph implementation from top-tier biological publications? Check out our curated collection at: Network - featuring dozens of publication-quality network analyses from Nature, Cell, Science, and other leading scientific journals, each with complete network methodology details and biological validation examples.
Related Articles
Flow Visualization Excellence: Sankey Diagrams in Systems Biology and Network Analysis
Master Sankey diagram creation for flow analysis and network visualization through real examples from Nature, Cell, and leading journals. Learn pathway mapping, resource allocation, and system dynamics.

Gene Expression Heatmaps: Pattern Recognition in Biological Research Publications
Master heatmap visualization for genomics and systems biology through real examples from Cell, Nature, and leading research journals. Learn clustering, color schemes, and pattern analysis.
Genomic Data Integration: Circos Plots in Circular Genome Visualization and Multi-Omics Analysis
Master Circos plot creation for genomic data integration and circular visualization through real examples from Nature Genetics, Cell, and leading journals. Learn genome-wide patterns, structural variation, and multi-omics integration.