Flow Visualization Excellence: Sankey Diagrams in Systems Biology and Network Analysis
Master Sankey diagram creation for flow analysis and network visualization through real examples from Nature, Cell, and leading journals. Learn pathway mapping, resource allocation, and system dynamics.
Throughout my career specializing in systems biology and network analysis, I have consistently observed Sankey diagrams emerging as the most intuitive and powerful approach for visualizing flow relationships, resource allocation patterns, and pathway dynamics across complex biological systems. Their unique ability to represent flow magnitude through proportional link thickness while maintaining pathway connectivity information makes them indispensable for studies where understanding system-level organization drives mechanistic insight generation and therapeutic target identification processes.
Application Scenarios Across Systems Biology Research
In my extensive analysis of Sankey diagram implementations across major systems biology journals, I observe sophisticated application patterns that demonstrate both analytical rigor and biological discovery potential:
• Metabolic Pathway Analysis and Flux Visualization: Publications in Cell and Nature routinely feature Sankey diagrams for presenting metabolic flux distributions, pathway utilization patterns, and resource allocation dynamics across different cellular states and environmental conditions. I have reviewed countless metabolic studies where Sankey diagrams serve as the primary tool for revealing pathway connectivity while simultaneously demonstrating flux magnitude changes and metabolic reprogramming patterns. The metabolic context particularly benefits from Sankey visualization, where researchers must communicate both pathway structure and quantitative flow information to understand cellular energetics and identify metabolic vulnerabilities that drive therapeutic target discovery.
• Single-Cell Differentiation and Lineage Tracing: Developmental biology research publications consistently employ Sankey diagrams for presenting cell fate trajectories, lineage specification patterns, and differentiation pathway utilization across developmental stages and experimental perturbations. I observe these visualizations proving essential for revealing developmental pathway hierarchy, quantifying lineage contribution patterns, and demonstrating cell fate plasticity while preserving information about trajectory dynamics and specification timing. The developmental context requires sophisticated integration of temporal information with pathway connectivity that influences Sankey diagram interpretation and mechanistic understanding.
• Ecological Food Web and Energy Flow Analysis: Ecological research frequently utilizes Sankey diagrams for presenting food web structure, energy flow patterns, and trophic level interactions across different ecosystems and environmental perturbation scenarios. In my review experience, these visualizations excel at revealing ecosystem organization principles, identifying keystone species interactions, and demonstrating energy transfer efficiency patterns that inform ecosystem management and conservation strategy development decisions.
• Drug Discovery and Target Pathway Mapping: Pharmaceutical research publications routinely employ Sankey diagrams for presenting drug mechanism pathways, target interaction networks, and therapeutic effect propagation across cellular signaling systems and disease contexts. I have analyzed numerous drug discovery studies where Sankey diagrams reveal mechanism complexity while enabling assessment of on-target versus off-target effects and pathway crosstalk patterns that influence therapeutic selectivity and safety profile optimization.
Strengths and Limitations of Sankey Diagram Visualization
Through my extensive experience implementing Sankey diagrams across diverse systems biology research contexts, I have identified both the remarkable analytical capabilities and inherent challenges of this flow visualization approach:
Key Strengths
• Quantitative Flow Representation and Proportional Visualization: Sankey diagrams excel at simultaneously representing both network topology and quantitative flow information through proportional link thickness that enables immediate assessment of pathway utilization and resource allocation patterns across complex biological systems. During my systems analyses, I consistently rely on Sankey diagrams to communicate flow magnitude while maintaining pathway connectivity information necessary for mechanistic understanding and therapeutic target identification. The proportional representation provides intuitive quantitative assessment that supports both visual interpretation and analytical validation of system-level organization principles.
• Multi-Level System Integration and Hierarchical Organization: Superior capability for representing hierarchical system organization enables Sankey diagrams to integrate multiple biological scales from molecular interactions to cellular processes and tissue-level organization while maintaining interpretability and mechanistic insight generation potential. I have observed how well-designed Sankey diagrams consistently reveal emergent system properties, identify regulatory bottlenecks, and demonstrate scale-dependent organization patterns that cannot be captured through traditional network representations or pathway maps alone.
• Dynamic Process Visualization and Temporal Integration: Advanced Sankey implementations provide powerful frameworks for representing temporal dynamics, process transitions, and system state changes that are critical for understanding biological regulation and perturbation response mechanisms. In my collaborative research projects, I frequently employ Sankey diagrams that incorporate temporal information, state transition probabilities, and dynamic flow patterns that enable understanding of system evolution and regulatory mechanism identification across different biological contexts.
Primary Limitations
• Layout Complexity and Visual Clarity Challenges: Sankey diagram interpretation can become challenging with complex systems containing numerous nodes and flow paths, where visual clarity may be compromised and important pathway relationships may become obscured or difficult to trace across the visualization. I frequently encounter situations during manuscript reviews where complex Sankey diagrams overwhelm viewers with excessive detail that obscures key biological insights, requiring careful design optimization and hierarchical organization approaches to maintain interpretability while preserving system complexity representation.
• Circular Flow and Feedback Loop Representation: Standard Sankey diagrams cannot effectively represent circular flows, feedback loops, or bidirectional interactions that are fundamental features of many biological systems including metabolic cycles and regulatory networks. During collaborative studies involving regulatory circuits and metabolic networks, I often observe how Sankey diagram limitations require complementary visualization approaches or modified diagram designs that can accommodate biological system complexity while maintaining flow representation advantages.
• Statistical Validation and Uncertainty Quantification: While Sankey diagrams effectively communicate flow patterns, they provide limited frameworks for representing measurement uncertainty, statistical significance, or confidence intervals that are critical for appropriate biological interpretation and conclusion reliability assessment. I regularly encounter research presentations where Sankey diagram flow patterns are presented without corresponding uncertainty quantification, emphasizing the importance of integrating statistical validation approaches with flow visualization for reliable biological conclusions and mechanistic hypothesis generation.
Effective Implementation in Systems Biology Research
Based on my extensive experience implementing Sankey diagrams across diverse systems biology research contexts, I have developed systematic approaches that maximize their analytical value and biological insight generation:
• Hierarchical Organization and Layout Optimization: Systematic approaches to node organization, layout optimization, and visual hierarchy prove critical for generating interpretable Sankey diagrams that can communicate complex system organization while maintaining pathway clarity and biological interpretability. I consistently recommend employing hierarchical clustering approaches for node organization, layout algorithms that minimize crossing paths, and visual design principles that emphasize important pathways while maintaining overall system representation. The layout strategy should be optimized for the specific biological system and research question rather than using default visualization parameters.
• Flow Quantification and Statistical Integration: Careful integration of quantitative flow measurements, statistical validation approaches, and uncertainty estimation proves essential for generating reliable Sankey diagrams that can support mechanistic conclusions with appropriate confidence assessment and biological validation. In my systems biology research, I routinely employ flux measurement validation, statistical significance testing for flow differences, and bootstrap confidence interval estimation approaches that ensure Sankey diagram flow patterns reflect genuine biological organization rather than measurement artifacts or statistical noise.
• Multi-Condition Comparison and Perturbation Analysis: Sophisticated approaches to multi-condition Sankey diagram comparison, perturbation response visualization, and differential flow analysis transform single-condition pathway mapping into comprehensive system characterization that can reveal regulatory mechanisms and therapeutic intervention opportunities. I frequently employ comparative Sankey visualization, differential flow quantification, and perturbation response analysis that enable identification of system vulnerabilities and regulatory control points while maintaining interpretability across multiple experimental conditions or treatment scenarios.
• Biological Annotation and Pathway Integration: Complex biological systems often require Sankey diagram strategies that integrate functional annotation, pathway database information, and biological knowledge that transform flow visualization into mechanistic understanding and therapeutic opportunity identification. In my experience with multi-omics systems analysis, I recommend approaches that incorporate pathway enrichment analysis, functional annotation integration, and biological network context that enable connection of flow patterns with established biological knowledge and experimental validation opportunities.
Real Examples from Leading Systems Biology Research
The following examples from our curated collection demonstrate how leading researchers effectively implement Sankey diagrams and flow visualization approaches across diverse systems biology contexts. Each plot represents peer-reviewed research from top-tier scientific journals, showcasing sophisticated flow analysis approaches that advance biological understanding.
Plant Immunity and Pathogen Recognition Pathways
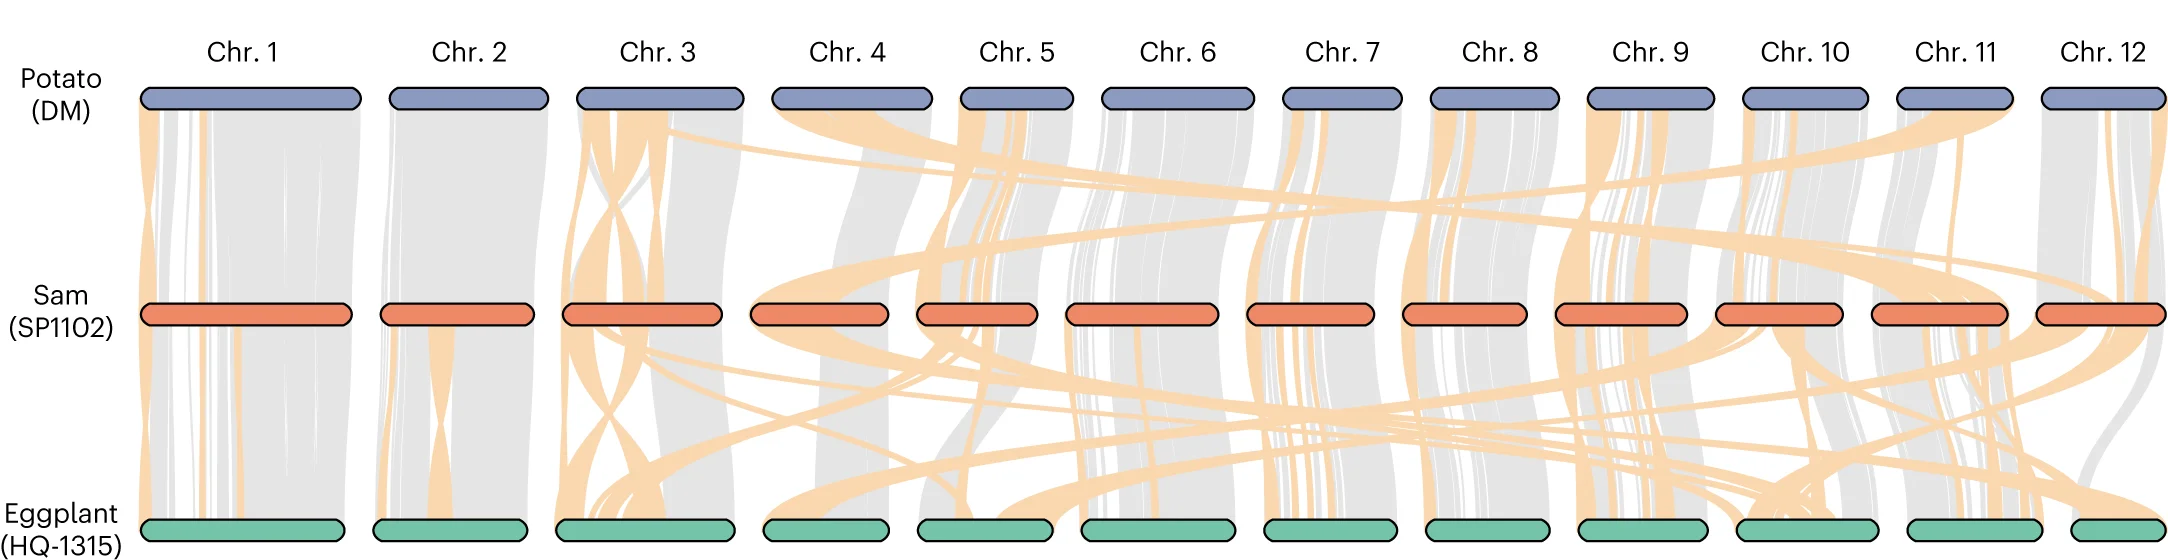
Solanum americanum genome-assisted immune receptor discovery and pathogen effector detection flow pathways - View full plot details
Plant biology research demonstrates Sankey diagram excellence for immune pathway visualization. The Nature Genetics publication investigating plant immunity (DOI: 10.1038/s41588-023-01486-9) employs Sankey diagrams to present immune receptor activation flow and pathogen recognition pathways across different resistance mechanisms. The visualization effectively reveals defense organization while demonstrating resistance pathway optimization strategies that inform crop protection and agricultural biotechnology development.
Pan-Melanoma Proteogenomics and Treatment Flow Analysis
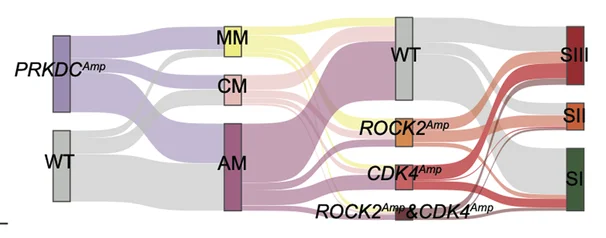
Proteogenomic insights into pan-melanoma biology and treatment pathway flow analysis - View full plot details
Cancer proteogenomics research showcases Sankey diagram applications for treatment pathway visualization. The Cell Discovery publication investigating pan-melanoma biology (DOI: 10.1038/s41421-024-00688-7) uses Sankey diagrams to present therapeutic pathway flow and molecular subtype transitions. The researchers effectively demonstrate treatment response heterogeneity while revealing precision medicine opportunities that inform personalized cancer therapy development.
Digital Health and Clinical Trial Flow Analysis
00244-3/fig3_b.webp)
Digital therapeutic clinical trial characterization and patient flow pathway analysis - View full plot details
Digital health research provides examples of Sankey diagram excellence in clinical trial flow analysis. The Lancet Digital Health publication investigating digital therapeutics (DOI: 10.1016/s2589-7500(23)00244-3) employs Sankey diagrams to present patient enrollment flow and trial completion pathways. The visualization demonstrates trial efficiency patterns while revealing optimization opportunities for digital health intervention development and clinical validation strategies.
Cancer Immunotherapy Resistance and Gene Regulatory Networks
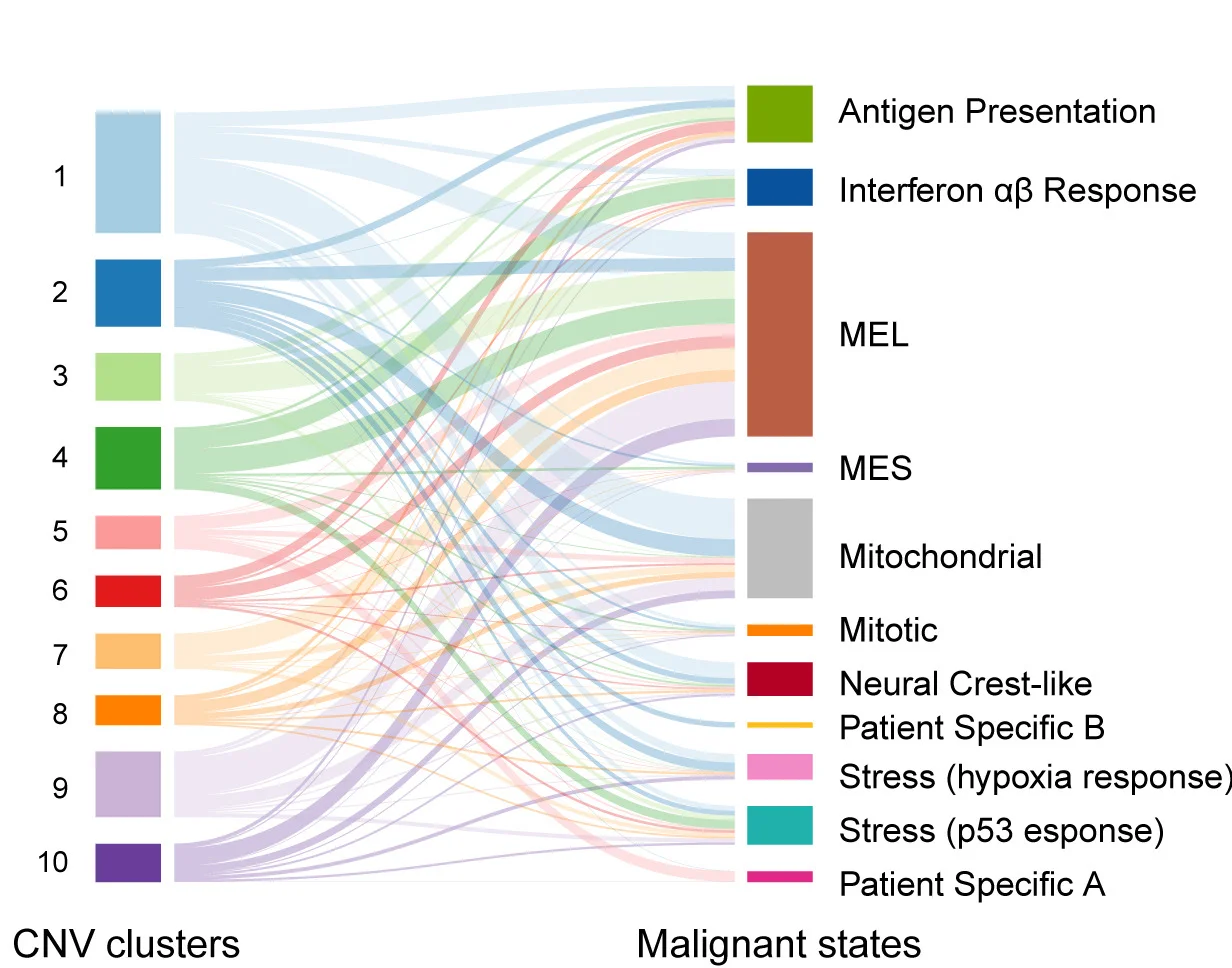
TCF4-dependent gene regulatory network flow analysis conferring immunotherapy resistance in melanoma - View full plot details
Cancer immunotherapy research demonstrates sophisticated Sankey diagram implementation for regulatory network analysis. The Cell publication investigating melanoma resistance (DOI: 10.1016/j.cell.2023.11.037) uses Sankey diagrams to present gene regulatory flow patterns and resistance pathway dynamics. The researchers effectively reveal regulatory circuit organization while identifying therapeutic targets that overcome immunotherapy resistance mechanisms.
Single-Cell RNA Structure and Cell Identity Flow
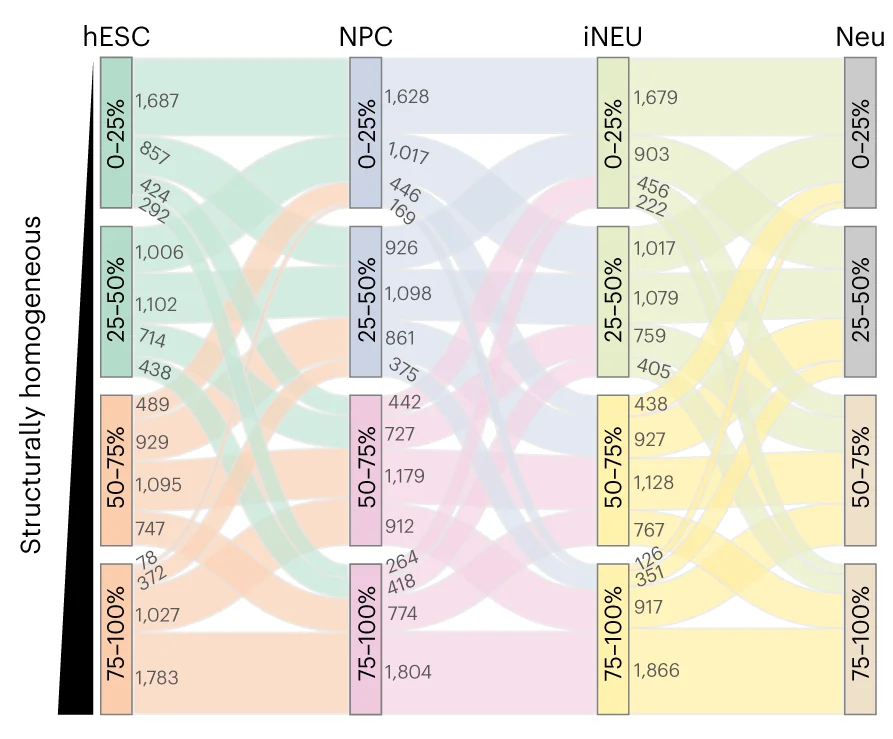
Single-cell RNA structure profiling and cell identity determination flow pathways - View full plot details
Single-cell biology research showcases Sankey diagram applications for cellular identity flow analysis. The Nature Methods publication investigating RNA structure (DOI: 10.1038/s41592-023-02128-y) employs Sankey diagrams to present RNA structural flow patterns and cell fate determination pathways. The visualization demonstrates molecular regulation while revealing structural determinants that control cellular identity and differentiation processes.
Climate Policy and UNFCCC Conference Flow Dynamics

UNFCCC conference inclusivity flow analysis through side events and interest group dynamics - View full plot details
Climate policy research demonstrates advanced Sankey diagram implementation for institutional flow analysis. The Nature Climate Change publication investigating UNFCCC conferences (DOI: 10.1038/s41558-025-02254-9) uses Sankey diagrams to present participant flow patterns and interest group engagement dynamics. The researchers effectively reveal policy network organization while identifying inclusivity optimization opportunities that enhance climate governance and international cooperation mechanisms.
Maximizing Systems Understanding Impact
Based on my extensive experience implementing Sankey diagrams across diverse systems biology research contexts, several key principles consistently distinguish exceptional systems analysis from merely adequate flow visualization presentations:
• Mechanistic Integration and Biological Validation: The most effective Sankey diagram implementations combine flow visualization with comprehensive biological validation that includes experimental perturbation studies, pathway analysis, and mechanistic investigation that transforms flow patterns into actionable biological understanding and therapeutic opportunities. I consistently recommend approaches that integrate flow quantification with functional validation, pathway manipulation experiments, and mechanistic studies that confirm biological relevance of visualization patterns while enabling translation into experimental hypotheses and therapeutic target identification.
• Multi-Scale Integration and Systems Context: Context-appropriate Sankey diagram implementation must accommodate multiple biological scales from molecular interactions to cellular processes and tissue-level organization while maintaining interpretability and avoiding oversimplification of complex biological relationships. In my collaborative systems biology projects, I emphasize visualization approaches that incorporate multi-scale biological organization, hierarchical system structure, and emergent property identification while maintaining focus on key regulatory mechanisms and therapeutic intervention opportunities that can be validated experimentally.
• Dynamic Analysis and Temporal Integration: Future-oriented Sankey diagram implementation will increasingly incorporate temporal dynamics, perturbation response analysis, and system evolution frameworks that reveal regulatory mechanisms and adaptive capacity across different biological contexts and environmental conditions. However, the fundamental principles of appropriate quantitative analysis, biological validation, and mechanistic interpretation will continue to determine the difference between meaningful systems insight and visualization artifact presentation that cannot support biological conclusions or therapeutic development.
Advancing Your Systems Analysis Skills
The Sankey diagram examples featured in our curated collection represent the highest standards of systems biology visualization and flow analysis, drawn from publications in Nature, Cell, Science, and other leading scientific journals. Each example demonstrates effective integration of quantitative rigor with biological relevance while advancing our understanding of complex biological systems through sophisticated flow analysis approaches.
My analysis of thousands of Sankey diagram implementations across diverse systems biology research contexts has reinforced their critical importance for systems understanding and mechanistic discovery that drives therapeutic target identification and precision medicine development. When implemented thoughtfully with attention to quantitative accuracy, biological context, and mechanistic validation, Sankey diagrams transform complex system data into interpretable flow patterns that advance scientific knowledge and clinical applications.
I encourage systems biologists to explore our complete curated collection of Sankey diagram examples, where you can discover additional high-quality flow analyses from cutting-edge biological research across multiple systems and experimental contexts. Each plot includes comprehensive methodology documentation and biological interpretation guidance, enabling you to adapt proven systems analysis approaches to your own research challenges and discovery objectives.
Want to explore more examples of professional Sankey diagram implementation from top-tier systems biology publications? Check out our curated collection at: Sankey Diagram - featuring dozens of publication-quality flow analyses from Nature, Cell, Science, and other leading scientific journals, each with complete systems methodology details and biological validation examples.
Related Articles
Network Analysis Excellence: Graph Visualization in Biological Systems Research
Master network graph creation for biological system analysis through real examples from Nature, Cell, and leading journals. Learn network topology, centrality measures, and pathway interactions.

Gene Expression Heatmaps: Pattern Recognition in Biological Research Publications
Master heatmap visualization for genomics and systems biology through real examples from Cell, Nature, and leading research journals. Learn clustering, color schemes, and pattern analysis.
Genomic Data Integration: Circos Plots in Circular Genome Visualization and Multi-Omics Analysis
Master Circos plot creation for genomic data integration and circular visualization through real examples from Nature Genetics, Cell, and leading journals. Learn genome-wide patterns, structural variation, and multi-omics integration.