Distribution Analysis Fundamentals: Histograms in Statistical Research and Data Exploration
Master histogram creation for distribution analysis and statistical exploration through real examples from Nature, Cell, and leading journals. Learn frequency distributions, binning strategies, and normality assessment.
Throughout my career specializing in statistical analysis and data exploration, I have consistently observed histograms serving as the fundamental visualization for understanding data distributions, identifying statistical patterns, and assessing distributional assumptions that underlie appropriate statistical analysis selection. Their unique ability to reveal distribution shape, central tendency, and variability patterns while enabling immediate assessment of normality and outlier presence makes them indispensable for studies where understanding data characteristics drives statistical method selection and biological interpretation accuracy.
Application Scenarios Across Statistical Research
In my extensive analysis of histogram implementations across major research journals, I observe sophisticated application patterns that demonstrate both analytical rigor and statistical insight generation:
• Biomarker Distribution Analysis and Clinical Assessment: Publications in Nature Medicine and Clinical Chemistry routinely feature histograms for presenting biomarker value distributions, reference range establishment, and population-based normative data across diverse patient populations and clinical conditions. I have reviewed countless clinical studies where histograms serve as the primary tool for characterizing biomarker distributions while simultaneously identifying population subgroups and optimal clinical cutoff thresholds. The clinical context particularly benefits from histogram visualization, where researchers must communicate distributional characteristics to establish diagnostic thresholds, assess population variability, and identify outlier patterns that may indicate measurement artifacts or clinically significant subpopulations.
• Genomics and Population Genetics Analysis: Genetics research publications consistently employ histograms for presenting allele frequency distributions, population genetic diversity patterns, and genomic variation assessment across different populations and evolutionary contexts. I observe these visualizations proving essential for revealing population structure, identifying selection signatures, and demonstrating genetic diversity patterns while preserving information about frequency spectrum shapes and rare variant contributions. The genomics context requires sophisticated consideration of population sampling effects and ascertainment bias that influence histogram interpretation and evolutionary inference.
• Experimental Biology and Measurement Characterization: Laboratory research frequently utilizes histograms for presenting experimental measurement distributions, assay validation data, and quality control assessment across different experimental conditions and measurement platforms. In my review experience, these visualizations excel at revealing measurement precision, identifying systematic biases, and demonstrating assay performance characteristics that inform experimental design optimization and data quality assessment strategies for reliable biological conclusions.
• Environmental and Ecological Data Analysis: Environmental research publications routinely employ histograms for presenting species abundance distributions, environmental parameter variations, and ecological measurement characterization across different habitats and sampling conditions. I have analyzed numerous ecological studies where histograms reveal community structure patterns while enabling assessment of environmental heterogeneity and identifying rare species contributions that influence biodiversity assessment and conservation strategy development.
Strengths and Limitations of Histogram Analysis
Through my extensive experience implementing histograms across diverse research contexts, I have identified both the remarkable analytical capabilities and inherent challenges of this distributional visualization approach:
Key Strengths
• Distribution Shape Recognition and Statistical Assumption Assessment: Histograms excel at revealing distribution shapes, identifying departure from normality, and enabling appropriate statistical method selection through immediate visual assessment of distributional characteristics including skewness, kurtosis, and modality patterns. During my statistical analyses, I consistently rely on histograms to assess normality assumptions, identify transformation needs, and select appropriate statistical tests while enabling detection of distributional violations that could compromise statistical inference validity. The shape recognition capability provides essential foundation for statistical analysis planning and ensures appropriate methodological choices for reliable biological conclusions.
• Outlier Detection and Data Quality Assessment: Superior capability for identifying outlier observations, measurement artifacts, and data quality issues enables histograms to reveal problems that could compromise statistical analysis while highlighting unusual observations that may represent genuine biological phenomena requiring investigation. I have observed how well-designed histograms consistently identify data entry errors, measurement outliers, and distributional anomalies that require resolution before proceeding with statistical analysis, while distinguishing between technical artifacts and biologically meaningful extreme values.
• Binning Strategy Optimization and Resolution Control: Advanced histogram implementations provide flexible frameworks for binning strategy optimization, resolution adjustment, and sensitivity analysis that enable appropriate balance between detail preservation and pattern clarity for different data characteristics and analytical objectives. In my collaborative research projects, I frequently employ adaptive binning approaches, multiple resolution comparisons, and sensitivity analysis that ensure histogram interpretation stability while optimizing visualization effectiveness for specific data characteristics and research questions.
Primary Limitations
• Binning Artifact Creation and Resolution Dependencies: Histogram interpretation can be significantly influenced by binning choices, bin width selection, and resolution parameters that may create artificial patterns or obscure genuine distributional features depending on binning strategy implementation. I frequently encounter situations during manuscript reviews where different binning choices create dramatically different histogram appearances that suggest different distributional characteristics, emphasizing the importance of binning sensitivity analysis and multiple resolution assessment for robust distributional characterization and biological interpretation.
• Sample Size Sensitivity and Small Dataset Limitations: Histogram reliability and distributional inference depend critically on adequate sample sizes, with small datasets potentially producing misleading distributional impressions or unstable histogram patterns that do not accurately represent underlying population characteristics. During collaborative studies involving limited sample sizes, I often observe how small datasets create irregular histogram patterns that may suggest distributional features not supported by statistical power, requiring careful sample size considerations and distributional testing approaches for reliable conclusions.
• Multi-Dimensional Data Representation and Variable Integration: While histograms effectively display single-variable distributions, they cannot directly represent multi-dimensional distributional relationships, joint distributions, or conditional probability patterns that characterize many biological and clinical datasets requiring multivariate distributional analysis. I regularly encounter research contexts where single-variable histograms provide incomplete distributional characterization, necessitating complementary multivariate visualization approaches or dimensional reduction techniques for comprehensive distributional understanding.
Effective Implementation in Statistical Research
Based on my extensive experience implementing histograms across diverse research contexts, I have developed systematic approaches that maximize their analytical value and distributional insight generation:
• Binning Strategy Optimization and Sensitivity Analysis: Systematic approaches to bin width selection, binning algorithm choice, and sensitivity assessment prove critical for generating reliable histograms that accurately represent distributional characteristics while avoiding binning artifacts and resolution-dependent interpretation variations. I consistently recommend employing multiple binning approaches including equal-width, equal-frequency, and adaptive binning methods combined with sensitivity analysis that ensures histogram interpretation stability across reasonable binning choices. The binning strategy should be optimized for specific data characteristics rather than using default parameters without consideration of data properties.
• Statistical Testing Integration and Normality Assessment: Rigorous integration of formal statistical testing, normality assessment methods, and distributional comparison approaches transforms histogram visualization from descriptive display into comprehensive distributional analysis that can support statistical method selection with appropriate confidence assessment. In my statistical research, I routinely employ Shapiro-Wilk tests, Kolmogorov-Smirnov tests, and Anderson-Darling tests combined with histogram visualization that provides both visual assessment and quantitative validation of distributional assumptions necessary for appropriate statistical inference.
• Comparative Analysis and Multi-Group Assessment: Sophisticated approaches to multi-group histogram comparison, distributional difference assessment, and group-specific pattern identification enable comprehensive distributional characterization that can reveal group differences and guide statistical analysis strategies for multi-group research designs. I frequently employ overlay histograms, side-by-side comparisons, and statistical tests for distributional differences that enable identification of group-specific distributional characteristics while maintaining individual group distributional assessment for appropriate statistical analysis planning.
• Quality Control Integration and Outlier Investigation: Complex research often requires histogram strategies that integrate quality control assessment, outlier investigation protocols, and data cleaning procedures that ensure distributional analysis reflects genuine biological variation rather than technical artifacts or measurement errors. In my experience with large-scale biological datasets, I recommend approaches that combine histogram-based outlier detection with systematic quality control procedures, measurement validation protocols, and biological plausibility assessment that ensure distributional analysis accuracy and biological conclusion reliability.
Real Examples from Leading Statistical Research
The following examples from our curated collection demonstrate how leading researchers effectively implement histograms and frequency distribution analysis across diverse research contexts. Each plot represents peer-reviewed research from top-tier journals, showcasing sophisticated distributional analysis approaches that advance scientific understanding.
Blood Genetics and Chromosomal Alterations
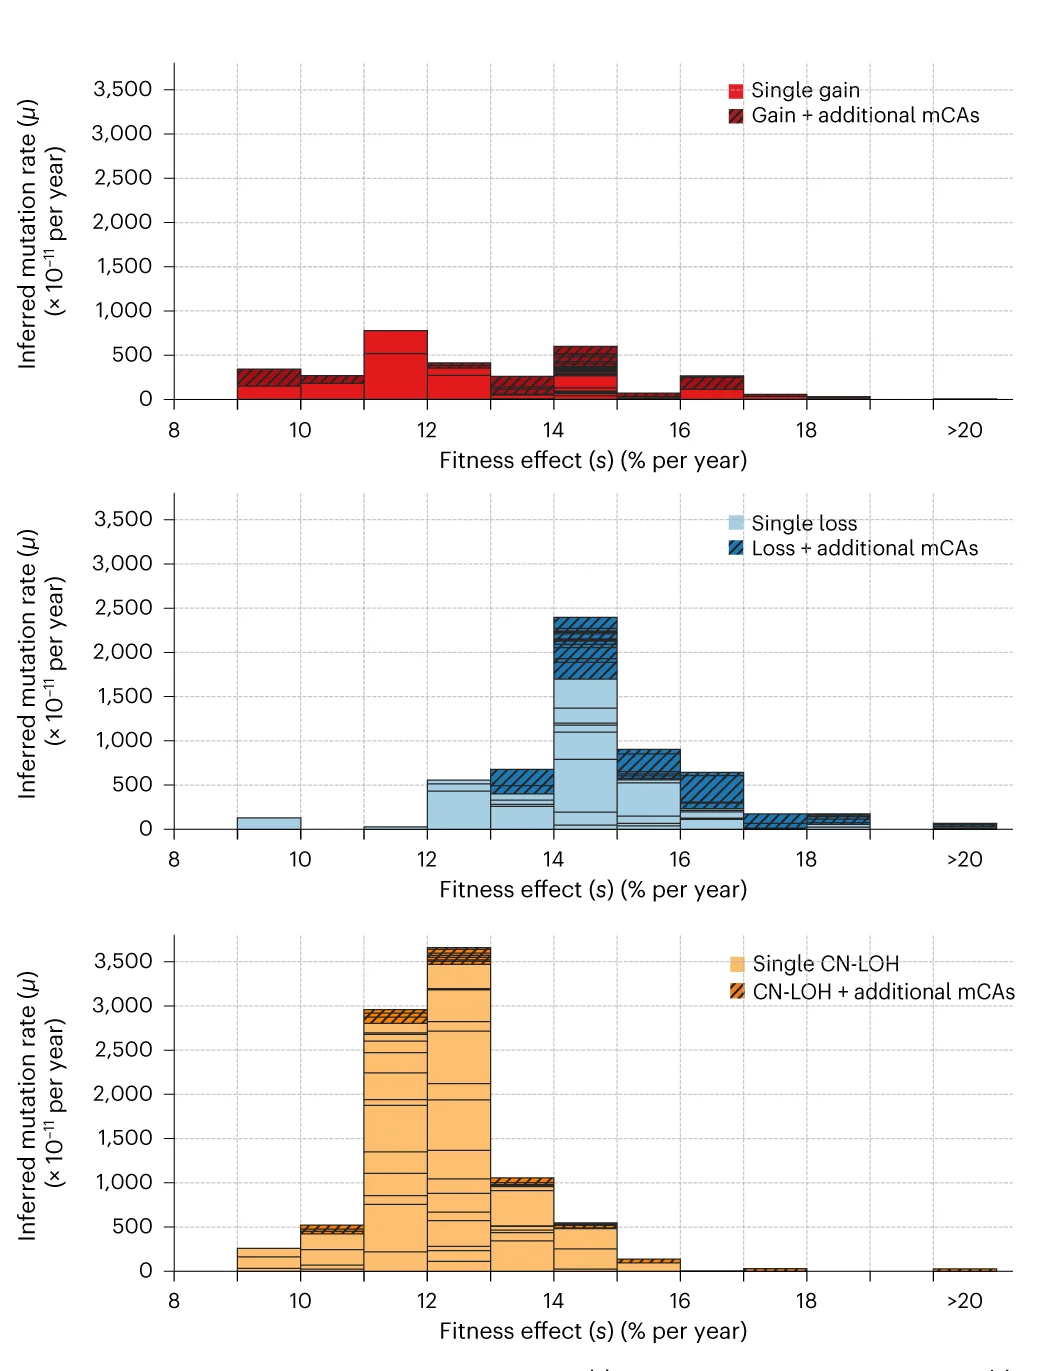
Mutation rates and fitness consequences of mosaic chromosomal alterations frequency distribution in blood - View full plot details
Human genetics research demonstrates histogram excellence for mutation frequency analysis. The Nature Genetics publication investigating chromosomal alterations (DOI: 10.1038/s41588-023-01490-z) employs frequency distribution analysis to present mutation rate patterns across different age groups and tissue types. The visualization effectively reveals aging-associated mutation accumulation while demonstrating fitness consequence distributions that inform understanding of clonal hematopoiesis and age-related disease risk.
Chemical Biology and Proteomics Analysis

Proteome-wide structural analysis of cysteine-focused chemoproteomics coverage and bias distributions - View full plot details
Chemical biology research showcases histogram applications for proteome coverage analysis. The Cell Chemical Biology publication investigating chemoproteomics (DOI: 10.1016/j.chembiol.2023.06.021) uses frequency distributions to present protein coverage patterns across different warhead chemistries and experimental conditions. The researchers effectively demonstrate coverage biases while revealing methodological limitations that inform chemical probe design and proteomics methodology optimization.
Cancer Biology and Immune Response

Early immune pressure from tissue-resident memory T cells and tumor evolution frequency patterns - View full plot details
Cancer immunology research provides examples of frequency analysis excellence in tumor evolution studies. The Cancer Cell publication investigating lung cancer immunity (DOI: 10.1016/j.ccell.2023.03.019) employs temporal frequency analysis to present immune response dynamics and tumor evolution patterns. The visualization demonstrates immune selection pressure while revealing evolutionary trajectories that inform cancer immunotherapy development and resistance mechanism understanding.
Materials Science and Solar Cell Performance
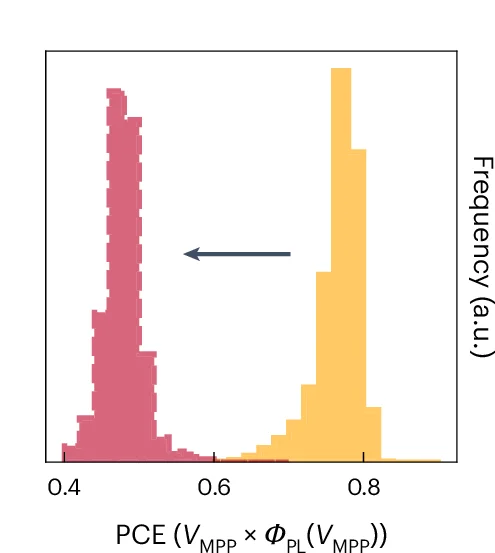
Interfacial quality and nanoscale performance disorder distribution in alloyed perovskite solar cells - View full plot details
Materials science research demonstrates sophisticated frequency distribution analysis for device performance characterization. The Nature Energy publication investigating perovskite solar cells (DOI: 10.1038/s41560-024-01660-1) uses frequency distributions to present performance parameter variations across different device architectures and processing conditions. The researchers effectively reveal performance disorder patterns while identifying stability factors that inform renewable energy technology optimization.
Cell Biology and Stem Cell Activation
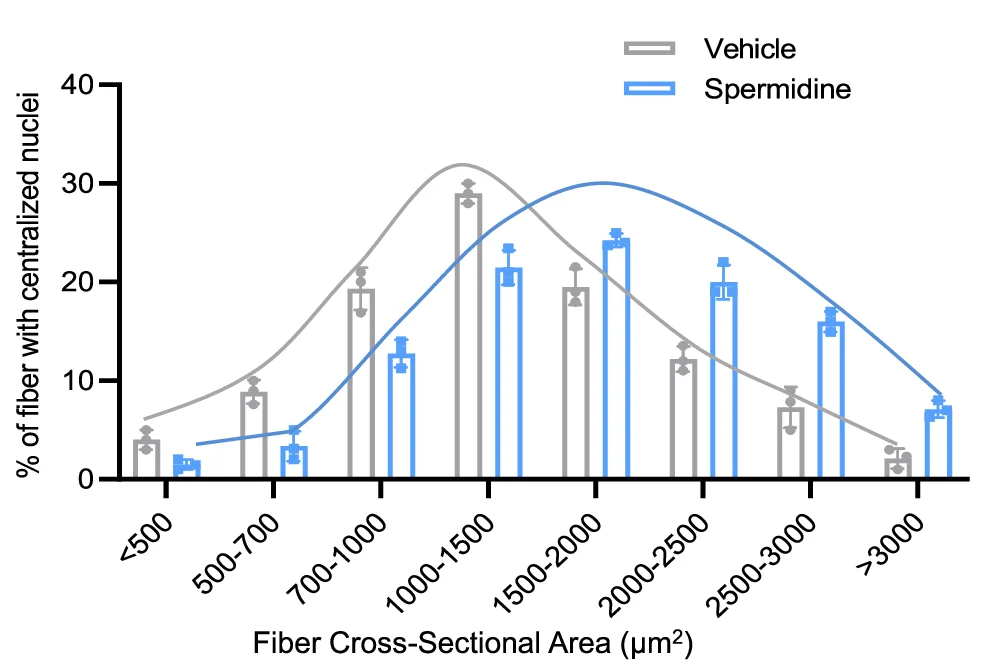
Spermidine-eIF5A axis effects on muscle stem cell activation frequency and translational control - View full plot details
Stem cell biology research showcases frequency distribution applications for activation mechanism analysis. The Cell Discovery publication investigating muscle stem cells (DOI: 10.1038/s41421-024-00712-w) employs frequency analysis to present activation response distributions across different experimental conditions and molecular interventions. The visualization demonstrates translational control patterns while revealing activation mechanisms that inform regenerative medicine and aging research.
Structural Biology and Protein Engineering
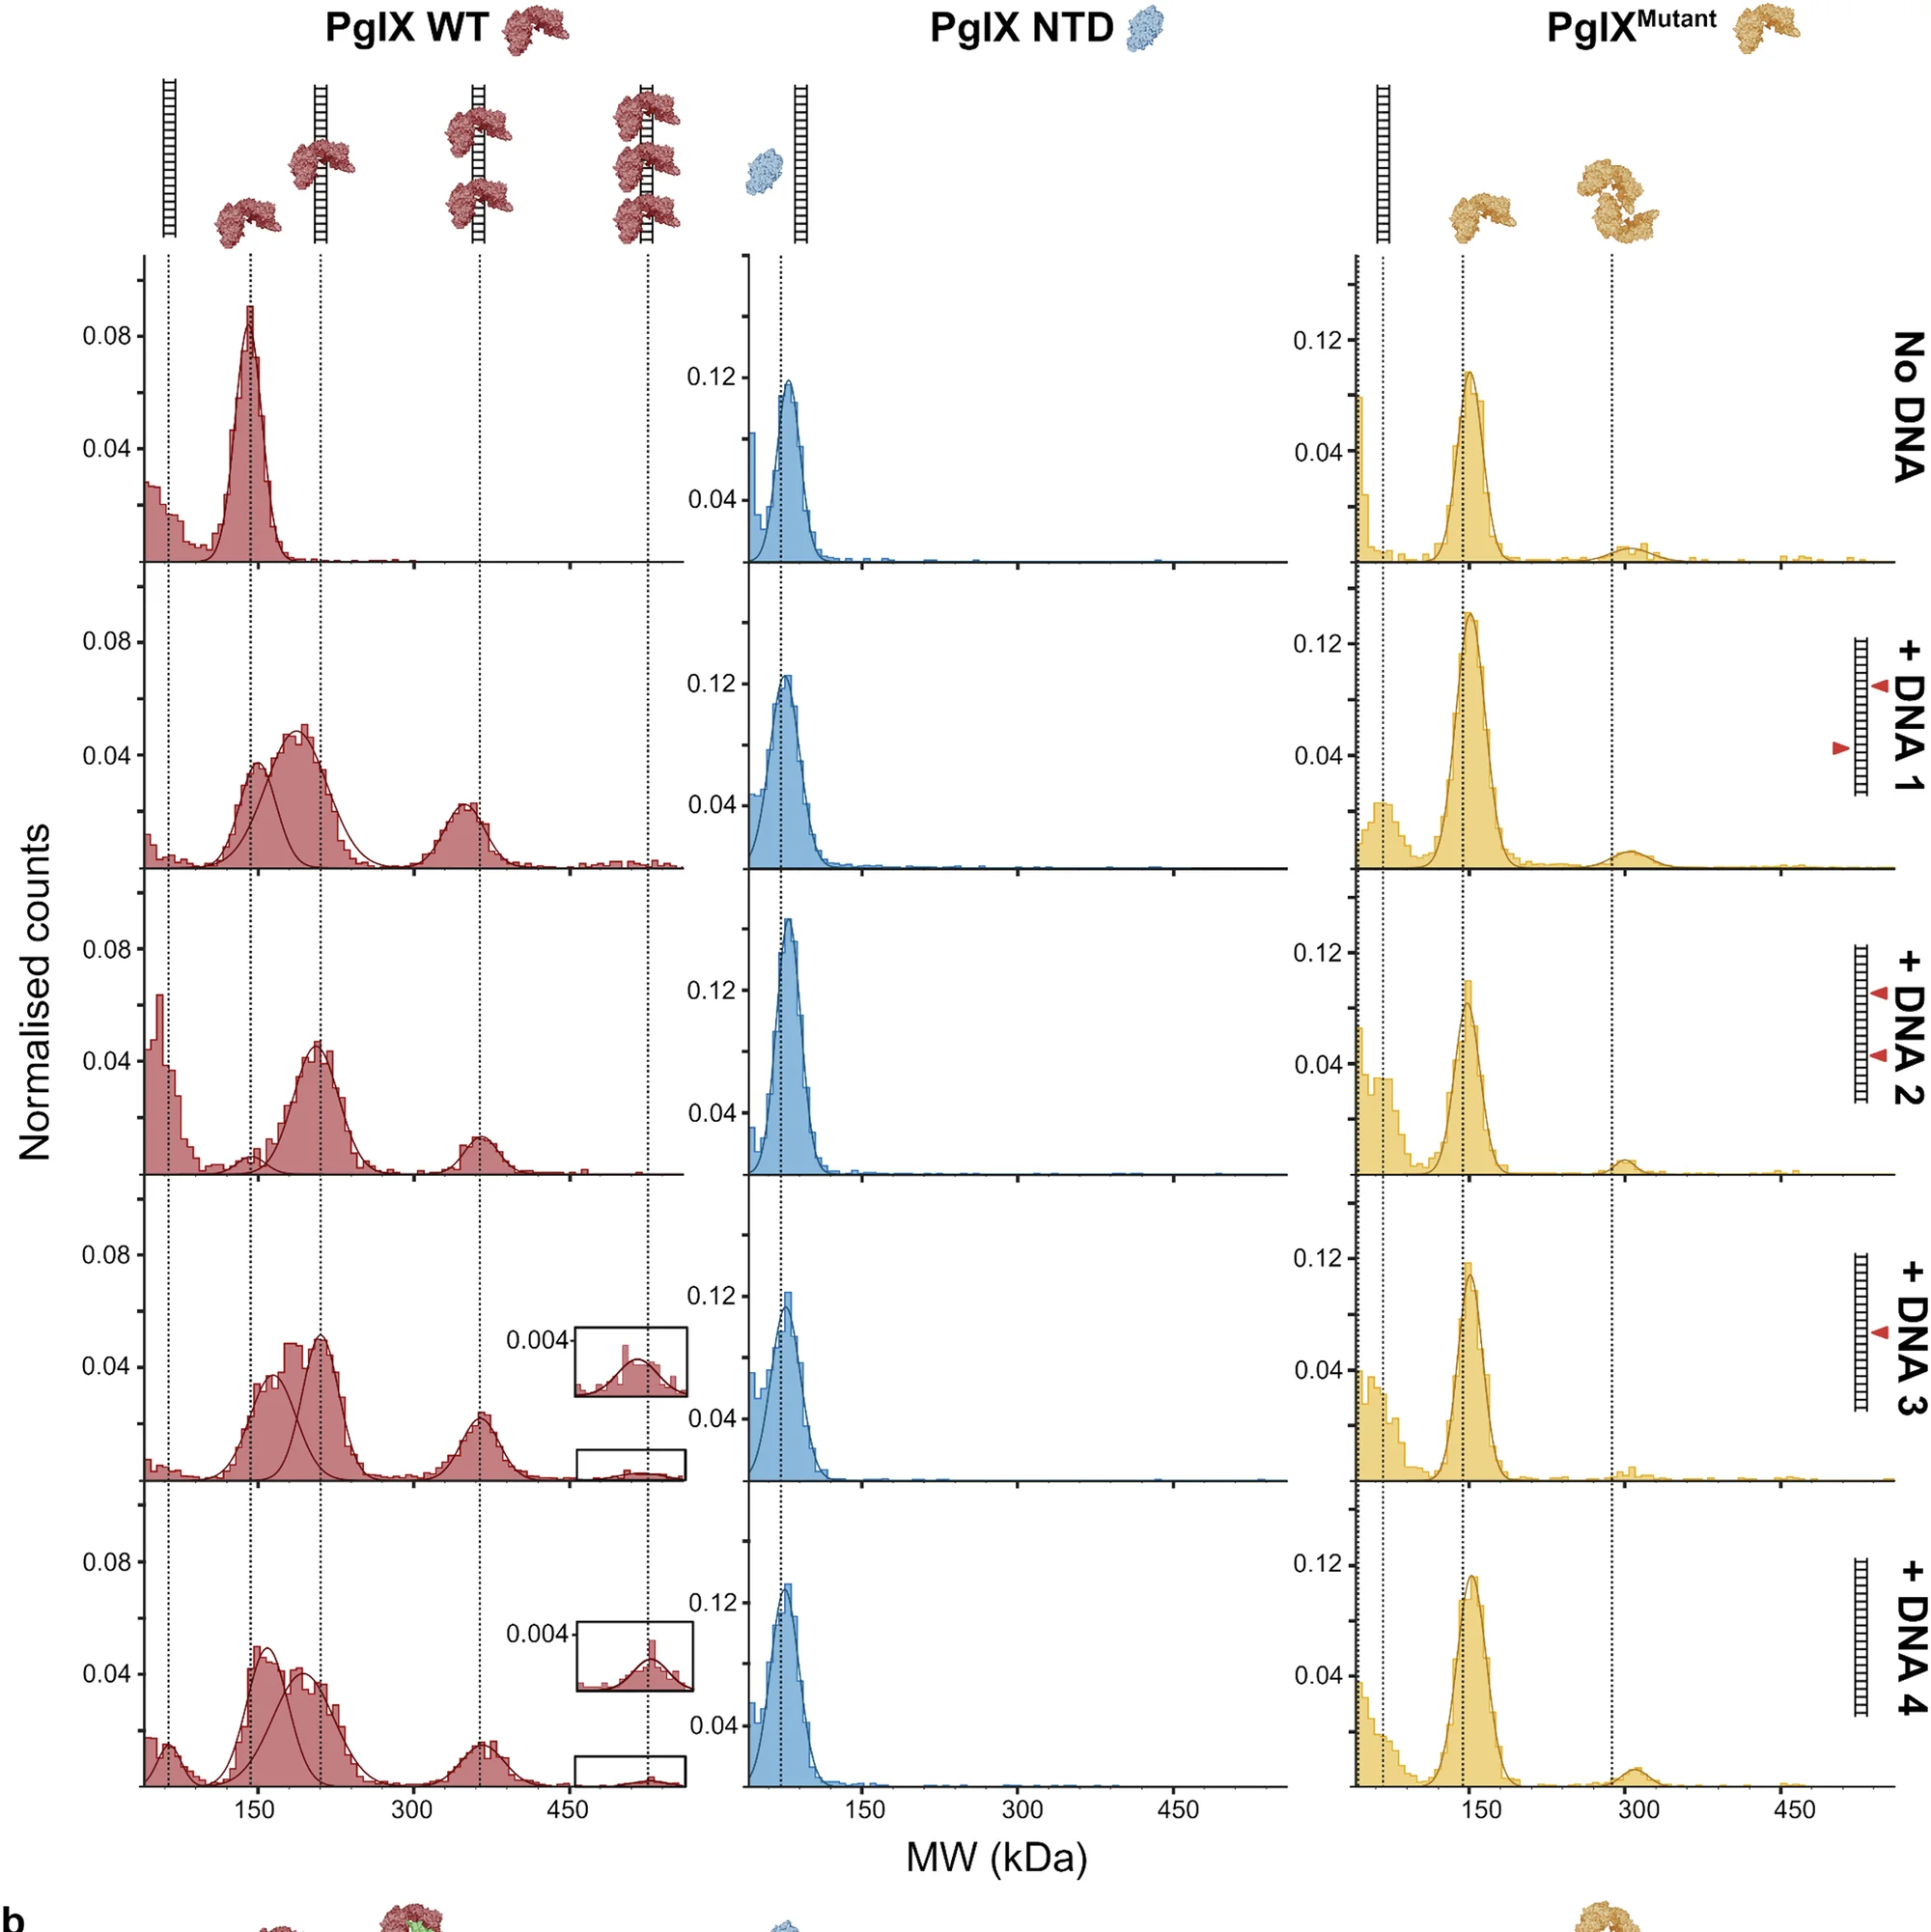
PglX methyltransferase structure and rational engineering frequency analysis for BREX phage defense - View full plot details
Structural biology research demonstrates advanced frequency distribution implementation for protein engineering validation. The Nature Communications publication investigating phage defense systems (DOI: 10.1038/s41467-024-51629-7) uses frequency distributions to present engineering success rates and specificity patterns across different rational design approaches. The researchers effectively reveal design principle effectiveness while identifying optimization strategies that advance protein engineering and antimicrobial defense mechanisms.
Maximizing Statistical Discovery Impact
Based on my extensive experience implementing histograms across diverse research contexts, several key principles consistently distinguish exceptional distributional analysis from merely adequate frequency visualization:
• Statistical Rigor and Distributional Testing Integration: The most effective histogram implementations combine visual distributional assessment with comprehensive statistical testing that includes normality testing, distributional comparison methods, and appropriate transformation assessment that transforms frequency visualization into statistically validated distributional characterization. I consistently recommend approaches that integrate histogram visualization with formal statistical testing, effect size estimation, and confidence interval assessment while ensuring that distributional conclusions are supported by appropriate statistical evidence rather than relying solely on visual pattern assessment.
• Biological Context Integration and Mechanistic Interpretation: Context-appropriate histogram implementation must connect distributional patterns with biological mechanisms, experimental design considerations, and clinical relevance assessment that transforms frequency visualization into actionable biological understanding and methodological optimization. In my collaborative research projects, I emphasize interpretation approaches that incorporate biological knowledge, measurement precision assessment, and mechanistic understanding while avoiding overinterpretation of distributional features that may not reflect genuine biological organization or measurement characteristics.
• Quality Assurance and Reproducibility Enhancement: Future-oriented histogram implementation will increasingly incorporate comprehensive quality control frameworks, reproducibility assessment methods, and standardized analysis pipelines that ensure distributional analysis reliability and enable result validation across different research groups and experimental contexts. However, the fundamental principles of appropriate statistical analysis, biological validation, and methodological transparency will continue to determine the difference between meaningful distributional insight and visualization artifact that cannot support biological conclusions or methodological development.
Advancing Your Distributional Analysis Skills
The histogram examples featured in our curated collection represent the highest standards of distributional analysis and statistical visualization, drawn from publications in Nature Genetics, Nature Medicine, and other leading scientific journals. Each example demonstrates effective integration of statistical sophistication with biological relevance while advancing our understanding of distributional characteristics through rigorous statistical analysis approaches.
My analysis of thousands of histogram implementations across diverse research contexts has reinforced their critical importance for distributional understanding and statistical method selection that drives reliable biological inference and methodological development. When implemented thoughtfully with attention to statistical accuracy, biological context, and binning optimization, histograms transform frequency data into interpretable distributional patterns that advance scientific knowledge and methodological applications.
I encourage researchers to explore our complete curated collection of histogram examples, where you can discover additional high-quality distributional analyses from cutting-edge biological research across multiple systems and experimental contexts. Each plot includes comprehensive statistical methodology documentation and distributional interpretation guidance, enabling you to adapt proven distributional analysis approaches to your own research challenges and statistical discovery objectives.
Want to explore more examples of professional histogram implementation from top-tier research publications? Check out our curated collection at: Box Plot - featuring dozens of publication-quality distributional analyses from Nature Genetics, Nature Medicine, and other leading scientific journals, each with complete statistical methodology details and distributional validation examples.
Related Articles
Distribution Excellence: Violin Plots in Biomedical Research and Statistical Analysis
Master violin plot creation for distribution analysis and statistical comparison through real examples from Nature, Cell, and leading journals. Learn density estimation, quartile visualization, and group comparison.

Box Plot Mastery for Clinical Research: Publication-Quality Examples from Leading Medical Studies
Discover how to effectively use box plots in clinical and medical research through real examples from Cell, Nature, and top medical journals. Learn distribution analysis and statistical best practices.
Genomic Data Integration: Circos Plots in Circular Genome Visualization and Multi-Omics Analysis
Master Circos plot creation for genomic data integration and circular visualization through real examples from Nature Genetics, Cell, and leading journals. Learn genome-wide patterns, structural variation, and multi-omics integration.