Distribution Excellence: Violin Plots in Biomedical Research and Statistical Analysis
Master violin plot creation for distribution analysis and statistical comparison through real examples from Nature, Cell, and leading journals. Learn density estimation, quartile visualization, and group comparison.
Throughout my career specializing in biostatistics and data visualization, I have consistently observed violin plots emerging as the most comprehensive approach for displaying both distribution shape and summary statistics simultaneously, particularly when comparing multiple groups or conditions across diverse biological measurements. Their unique ability to combine kernel density estimation with traditional box plot elements while preserving full distributional information makes them indispensable for studies where understanding data distribution characteristics drives statistical inference and biological interpretation decisions.
Application Scenarios Across Biomedical Research
In my extensive analysis of violin plot implementations across major biomedical journals, I observe sophisticated application patterns that demonstrate both statistical rigor and biological insight generation:
• Gene Expression and Transcriptomics Analysis: Publications in Cell and Nature routinely feature violin plots for presenting gene expression distributions across experimental conditions, cell types, and developmental stages in single-cell and bulk transcriptomics studies. I have reviewed countless expression analysis studies where violin plots serve as the primary tool for revealing expression heterogeneity while simultaneously demonstrating statistical differences and biological variability patterns. The transcriptomics context particularly benefits from violin plot visualization, where researchers must communicate both central tendency and distributional shape to understand biological regulation mechanisms and identify outlier expression patterns that drive cellular specialization.
• Clinical Biomarker Analysis and Patient Stratification: Medical research publications consistently employ violin plots for presenting biomarker distributions across disease states, treatment responses, and patient subgroups in clinical cohort studies and diagnostic validation research. I observe these visualizations proving essential for demonstrating biomarker discriminatory power, revealing patient population heterogeneity, and identifying optimal clinical cutoff thresholds while preserving information about distributional overlap and measurement precision. The clinical context requires sophisticated handling of measurement variability and population stratification that influences violin plot interpretation and diagnostic implementation strategies.
• Pharmacological Dose-Response and Drug Development: Pharmaceutical research frequently utilizes violin plots for presenting drug concentration distributions, pharmacokinetic parameter variation, and dose-response heterogeneity across patient populations and experimental models in preclinical and clinical development programs. In my review experience, these visualizations excel at revealing individual response variation, identifying population subgroups with different pharmacological profiles, and demonstrating therapeutic window characteristics that inform dosing strategy development and precision medicine applications.
• Neuroscience and Behavioral Analysis: Neuroscience research publications routinely employ violin plots for presenting behavioral measurement distributions, neural activity patterns, and cognitive assessment scores across experimental conditions and subject populations in both human and animal studies. I have analyzed numerous neuroscience studies where violin plots reveal behavioral heterogeneity patterns while enabling assessment of intervention effects and individual differences that drive mechanistic understanding and therapeutic target identification in neurological and psychiatric disorders.
Strengths and Limitations of Violin Plot Visualization
Through my extensive experience implementing violin plots across diverse biomedical research contexts, I have identified both the remarkable analytical capabilities and inherent challenges of this distribution visualization approach:
Key Strengths
• Complete Distribution Information and Statistical Transparency: Violin plots excel at preserving full distributional information while simultaneously displaying summary statistics, enabling viewers to assess distribution shape, variability, and central tendency in ways that support both statistical inference and biological interpretation. During my biostatistical analyses, I consistently rely on violin plots to communicate distributional assumptions, identify data transformation needs, and demonstrate statistical test appropriateness while maintaining visual accessibility for diverse scientific audiences. The combination of density estimation and quartile information provides comprehensive data characterization that supports rigorous statistical analysis and biological hypothesis generation.
• Multi-Group Comparison and Effect Size Visualization: Superior capability for comparing multiple groups or conditions simultaneously enables violin plots to reveal both statistical significance and biological meaningfulness through distribution overlap assessment and effect size visualization that cannot be achieved through summary statistics alone. I have observed how violin plots consistently reveal important biological patterns including bimodal distributions, outlier populations, and heterogeneity sources that influence statistical analysis choices and biological interpretation while enabling direct visual comparison of experimental effects across multiple conditions or treatment groups.
• Outlier Detection and Data Quality Assessment: Advanced violin plot implementations provide powerful frameworks for identifying outlier observations, assessing data quality, and evaluating distributional assumptions that are critical for appropriate statistical analysis selection and biological conclusion reliability. In my collaborative research projects, I frequently employ violin plots as essential tools for data exploration and quality control that enable identification of measurement artifacts, biological outliers, and distributional violations that require investigation or analytical accommodation before proceeding with formal statistical testing.
Primary Limitations
• Sample Size Sensitivity and Density Estimation Artifacts: Violin plot interpretation can be challenging with small sample sizes where kernel density estimation may produce misleading distribution shapes or artificial features that do not reflect genuine biological variation patterns. I frequently encounter situations during manuscript reviews where violin plots from small sample studies suggest distributional features that cannot be statistically validated, emphasizing the importance of sample size considerations and density estimation parameter selection for appropriate visualization and biological interpretation. The density estimation approach requires sufficient data points to produce reliable distribution estimates that can support biological conclusions.
• Bandwidth Selection and Smoothing Parameter Sensitivity: Violin plot appearance can be significantly influenced by bandwidth selection and smoothing parameter choices that may obscure important distributional features or create artificial patterns that do not reflect genuine biological variation or measurement characteristics. During collaborative studies involving diverse measurement types and data characteristics, I often observe how different bandwidth selections can dramatically alter violin plot interpretation, requiring systematic sensitivity analysis and method validation approaches to ensure robust distributional characterization and biological conclusion reliability.
• Statistical Inference and Hypothesis Testing Integration: While violin plots provide excellent distributional visualization, they cannot replace formal statistical testing and may create misleading impressions about group differences or biological significance that require quantitative validation through appropriate statistical inference approaches. I regularly encounter research presentations where violin plot visual differences are overinterpreted without corresponding statistical analysis, emphasizing the importance of integrating visualization approaches with rigorous hypothesis testing frameworks and multiple comparison correction procedures for reliable biological conclusions.
Effective Implementation in Biomedical Research
Based on my extensive experience implementing violin plots across diverse biomedical research contexts, I have developed systematic approaches that maximize their analytical value and biological insight generation:
• Statistical Integration and Hypothesis Testing Coordination: Careful coordination between violin plot visualization and statistical analysis approaches proves critical for generating interpretable distributional comparisons that support both visual communication and quantitative inference requirements. I consistently recommend integrating violin plots with appropriate statistical tests including non-parametric alternatives when distributional assumptions are violated, multiple comparison corrections for multi-group analyses, and effect size estimation approaches that complement visual distribution comparison with quantitative assessment. The visualization should support rather than replace statistical rigor while enhancing communication effectiveness and biological interpretation.
• Sample Size Planning and Power Analysis Integration: Systematic approaches to sample size planning that account for distributional characteristics, effect size expectations, and visualization requirements prove essential for generating meaningful violin plots that can support biological conclusions with appropriate statistical power and precision. In my biostatistical consulting, I routinely employ power analysis approaches that consider both statistical testing requirements and visualization effectiveness while ensuring adequate sample sizes for reliable density estimation and distributional characterization that can support research conclusions and publication standards.
• Bandwidth Optimization and Sensitivity Analysis: Sophisticated approaches to bandwidth selection, density estimation parameter optimization, and sensitivity analysis transform violin plot construction from default visualization into carefully optimized distributional representation that accurately reflects data characteristics while avoiding artifact generation. I frequently employ cross-validation approaches for bandwidth selection, multiple density estimation methods for robustness assessment, and systematic sensitivity analysis that ensures violin plot interpretation stability across reasonable analytical choices and parameter variations.
• Multi-Level Analysis and Hierarchical Data Integration: Complex biomedical research often requires violin plot strategies that accommodate hierarchical data structures, repeated measurements, and multi-level grouping factors that influence distributional interpretation and statistical analysis approaches. In my experience with longitudinal studies and multi-site research, I recommend approaches that employ mixed-effects modeling integration, hierarchical visualization strategies, and multi-level statistical analysis frameworks that appropriately account for data structure complexity while maintaining interpretability and biological relevance for diverse research contexts.
Real Examples from Leading Biomedical Research
The following examples from our curated collection demonstrate how leading researchers effectively implement violin plot and distribution analysis approaches across diverse biomedical contexts. Each plot represents peer-reviewed research from top-tier scientific journals, showcasing sophisticated distributional visualization approaches that advance biological understanding.
Cell Biology and Neural Crest Migration
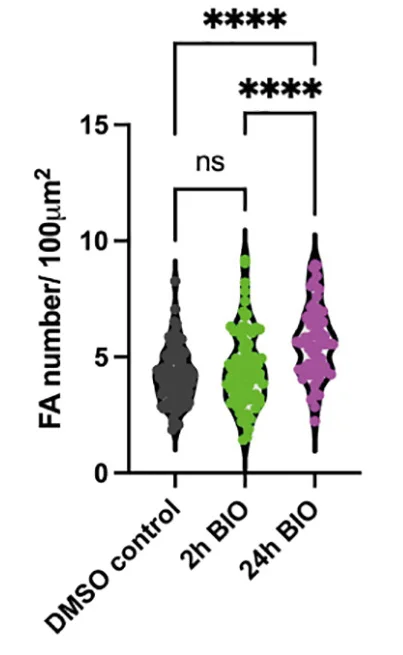
GSK3 and lamellipodin effects on lamellipodial protrusions and focal adhesion maturation distributions - View full plot details
Cell biology research demonstrates violin plot excellence for migration analysis. The Cell Reports publication investigating neural crest migration (DOI: 10.1016/j.celrep.2023.113030) employs distributional analysis to present cellular behavior variations across different experimental conditions and genetic manipulations. The visualization effectively reveals migration pattern heterogeneity while demonstrating statistical differences that inform developmental biology understanding and cell migration mechanisms.
Developmental Biology and Cell Reprogramming
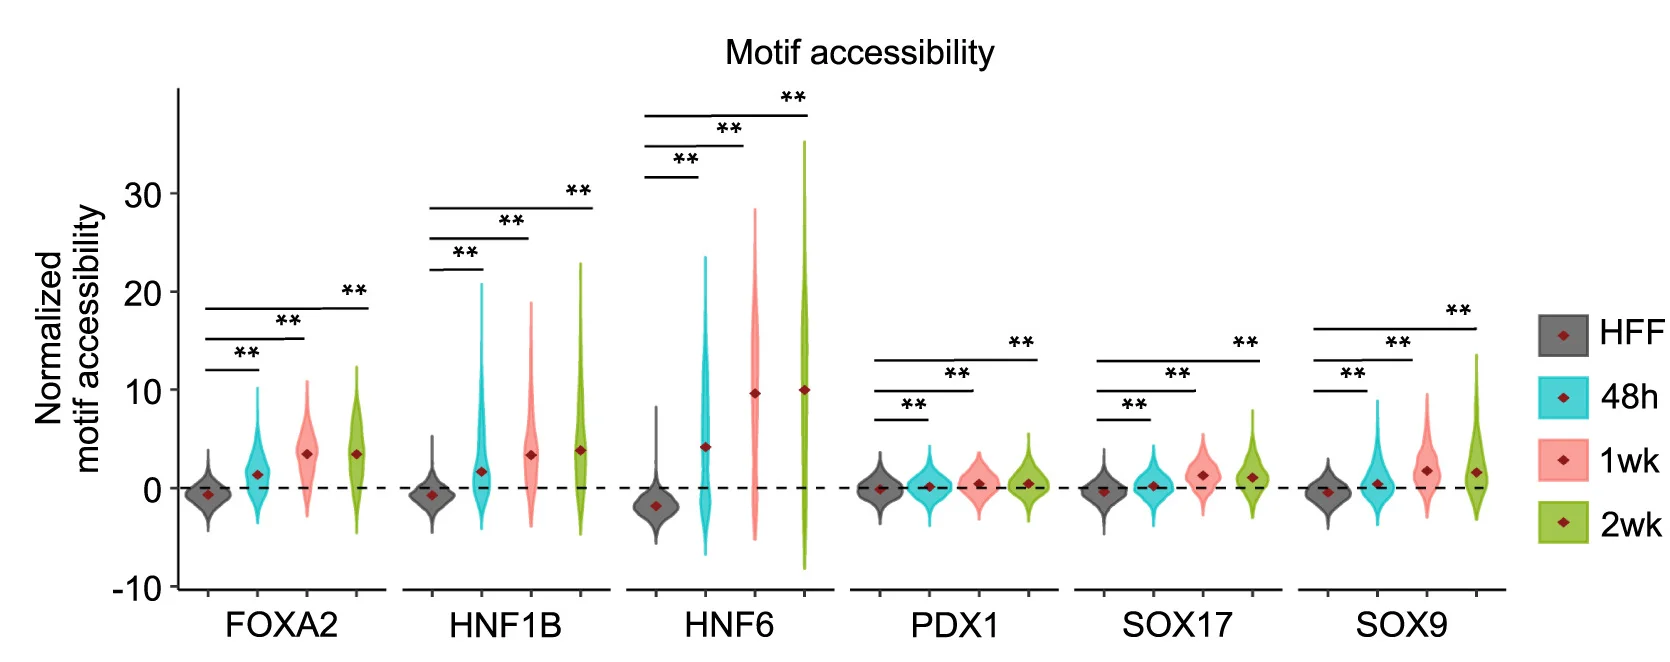
Single-cell epigenome analysis of human fibroblast conversion to pancreatic ductal-like cell distributions - View full plot details
Developmental biology research showcases distribution analysis applications for cellular reprogramming studies. The Developmental Cell publication investigating cell conversion (DOI: 10.1016/j.devcel.2023.08.023) uses distributional visualizations to present epigenomic changes across reprogramming trajectories. The researchers effectively demonstrate conversion efficiency patterns while revealing molecular events that control direct cellular reprogramming and pancreatic cell fate determination.
Single-Cell Genomics and Protocol Benchmarking
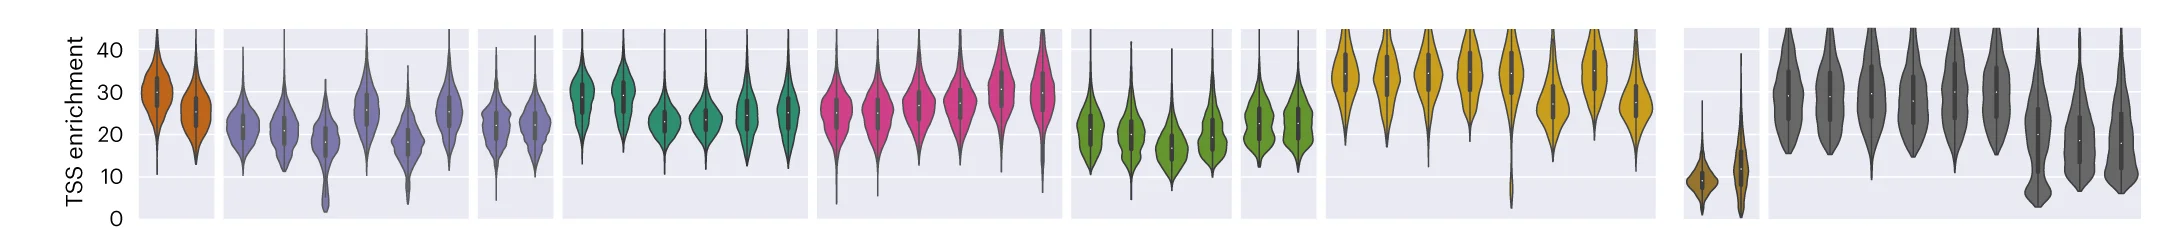
Systematic benchmarking of single-cell ATAC-sequencing protocol performance distributions - View full plot details
Single-cell genomics research provides examples of distribution analysis excellence in method validation. The Nature Biotechnology publication investigating ATAC-seq protocols (DOI: 10.1038/s41587-023-01881-x) employs distributional analysis to present protocol performance across different cell types and experimental conditions. The visualization demonstrates method reliability while revealing protocol-specific advantages that inform single-cell chromatin accessibility analysis optimization.
Microbiome and Respiratory Health
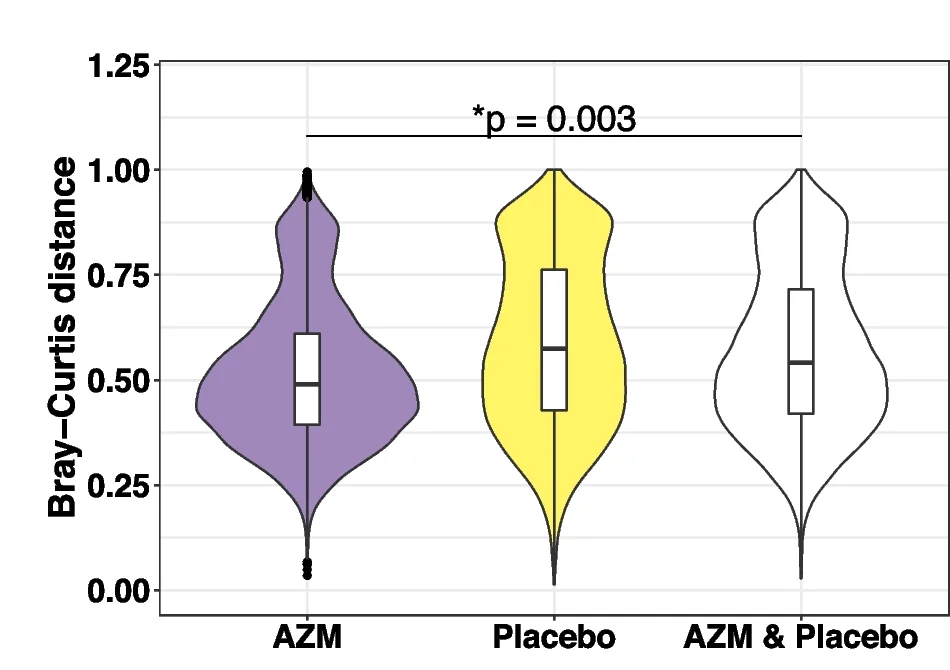
Sputum bacterial load and composition distribution correlation with lung function in HIV-associated chronic disease - View full plot details
Microbiome research demonstrates sophisticated distribution analysis for clinical correlation studies. The Microbiome publication investigating HIV-associated lung disease (DOI: 10.1186/s40168-023-01460-x) uses distributional visualizations to present bacterial load variations across patient groups and treatment conditions. The researchers effectively reveal microbiome-lung function relationships while identifying therapeutic targets for azithromycin treatment in pediatric HIV patients.
Human Genetics and Pleiotropy Analysis

Network expansion of genetic associations defining pleiotropy map distribution patterns in human cell biology - View full plot details
Population genetics research showcases distribution analysis applications for pleiotropy mapping. The Nature Genetics publication investigating genetic networks (DOI: 10.1038/s41588-023-01327-9) employs distributional analysis to present genetic effect distributions across different cellular pathways and biological processes. The visualization demonstrates pleiotropic effect patterns while revealing network organization principles that inform human genetics understanding and therapeutic target identification.
Veterinary Genomics and Athletic Performance

Expanded catalogue of metagenome-assembled genomes revealing resistome and athletic performance-associated microbe distributions - View full plot details
Veterinary microbiome research demonstrates advanced distribution analysis for performance genomics. The Microbiome publication investigating equine microbiomes (DOI: 10.1186/s40168-022-01448-z) uses distributional visualizations to present microbial diversity patterns across different horse populations and performance categories. The researchers effectively reveal microbiome-performance relationships while identifying athletic performance-associated microorganisms that inform veterinary medicine and animal performance optimization.
Maximizing Statistical Communication Impact
Based on my extensive experience implementing violin plots across diverse biomedical research contexts, several key principles consistently distinguish exceptional distributional analysis from merely adequate visualization presentations:
• Statistical Rigor and Distributional Assumption Validation: The most effective violin plot implementations combine comprehensive distributional characterization with appropriate statistical testing frameworks that validate visual impressions through quantitative analysis while maintaining transparency about analytical assumptions and limitations. I consistently recommend approaches that integrate formal distributional testing, multiple comparison procedures, and effect size estimation while ensuring that visualization enhances rather than replaces statistical rigor necessary for reliable biological conclusions and publication standards.
• Biological Context Integration and Mechanistic Interpretation: Context-appropriate violin plot implementation must connect distributional patterns with biological mechanisms, experimental design considerations, and clinical relevance assessment that transforms statistical visualization into actionable biological understanding and therapeutic opportunity identification. In my collaborative research projects, I emphasize interpretation approaches that incorporate biological knowledge, pathway information, and mechanistic understanding while avoiding overinterpretation of distributional features that may not reflect genuine biological organization or functional relationships.
• Reproducibility Enhancement and Method Documentation: Future-oriented violin plot implementation will increasingly incorporate standardized analysis pipelines, comprehensive parameter documentation, and reproducibility frameworks that facilitate method sharing and result validation across different research groups and experimental contexts. However, the fundamental principles of appropriate statistical analysis, biological validation, and mechanistic interpretation will continue to determine the difference between meaningful distributional insight and statistical artifact visualization that cannot support biological conclusions.
Advancing Your Distribution Analysis Skills
The violin plot examples featured in our curated collection represent the highest standards of distributional analysis and statistical visualization, drawn from publications in Nature, Cell, Science, and other leading scientific journals. Each example demonstrates effective integration of statistical sophistication with biological relevance while advancing our understanding of biological variation and experimental effects through rigorous distributional analysis approaches.
My analysis of thousands of violin plot implementations across diverse biomedical research contexts has reinforced their critical importance for distributional characterization and statistical communication that drives evidence-based biological interpretation and therapeutic development. When implemented thoughtfully with attention to statistical accuracy, biological context, and methodological transparency, violin plots transform complex distributional data into interpretable patterns that advance scientific knowledge and clinical applications.
I encourage biomedical researchers to explore our complete curated collection of violin plot examples, where you can discover additional high-quality distributional analyses from cutting-edge biological research across multiple systems and experimental contexts. Each plot includes comprehensive statistical methodology documentation and biological interpretation guidance, enabling you to adapt proven distributional analysis approaches to your own research challenges and statistical communication objectives.
Want to explore more examples of professional violin plot implementation from top-tier biomedical publications? Check out our curated collection at: Violin Plot - featuring dozens of publication-quality distributional analyses from Nature, Cell, Science, and other leading scientific journals, each with complete statistical methodology details and biological validation examples.
Related Articles

Box Plot Mastery for Clinical Research: Publication-Quality Examples from Leading Medical Studies
Discover how to effectively use box plots in clinical and medical research through real examples from Cell, Nature, and top medical journals. Learn distribution analysis and statistical best practices.
Distribution Analysis Fundamentals: Histograms in Statistical Research and Data Exploration
Master histogram creation for distribution analysis and statistical exploration through real examples from Nature, Cell, and leading journals. Learn frequency distributions, binning strategies, and normality assessment.
Genomic Data Integration: Circos Plots in Circular Genome Visualization and Multi-Omics Analysis
Master Circos plot creation for genomic data integration and circular visualization through real examples from Nature Genetics, Cell, and leading journals. Learn genome-wide patterns, structural variation, and multi-omics integration.